Market Commentary - For the week ending 17 May 2024
Market Commentary (Hong Kong)
For the week ending 17 May 2024
Gold is nearing its all time high and in fact closed at its highest end-of-day and end-of-week till date. Market is increasingly alarmed that the US economy could enter stagflation.
● Sovereign funds poured into China’s A-share listed companies through the Qualified Foreign Institutional Investor (QFII) channel in Q1. Investors include the Abu Dhabi Investment Authority and the Kuwait Investment Authority.
● The US threatened India with sanctions for signing a 10-year contract to operate Iran’s Chabahar Port.
● China started selling part of 1-trillion yuan ultra-long sovereign bonds, the fourth of its kind in 26 years. These will fund government spending on infrastructure.
● The US imposed tariffs on Chinese goods including EVs, batteries, aluminum and steel.
● UN Special Rapporteur on unilateral coercive measures and human rights, Alena Douhan, said that unilateral sanctions by the US against China do not conform to international norms and can be qualified as coercive.
● China announced a basket of measures to bolster the property market including reducing down payment and tweaks to housing and commercial rates. Government-back firms could also purchase surplus property to convert into affordable housing.
Hang Seng Index closed this week at 19553, up 590 points or 3.11%. The index passed the 19000 decisively and closed with a solid bullish candle. It is also trading above its entire basket of moving averages. This is a setup associated with further gains.
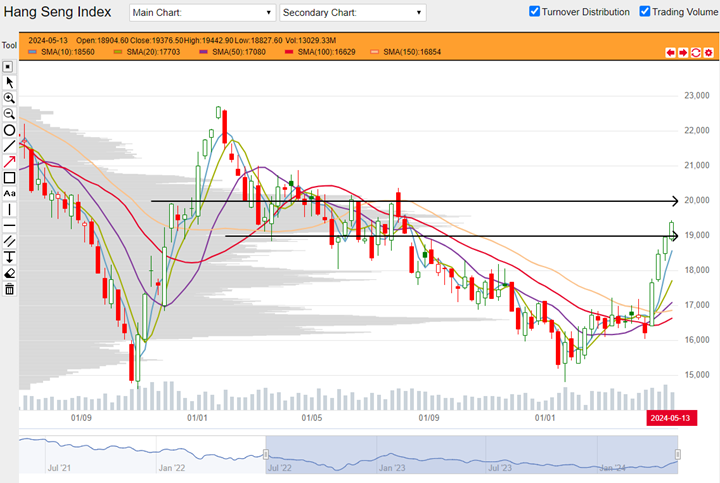
HSI weekly chart from 04 July 2022 to 17 May 2024 (Source: DLC.socgen.com)
Hang Seng Tech closed the week at 4113, up 150 points or 3.79%. 4000 which was a resistance the past two weeks was overcome this week. The index is trading above its entire basket of moving averages. This is a setup associated with further gains. Between 4250 - 4300 there is a zone where multiple swing highs in the past two years can be found. This could be a potential level to contest.
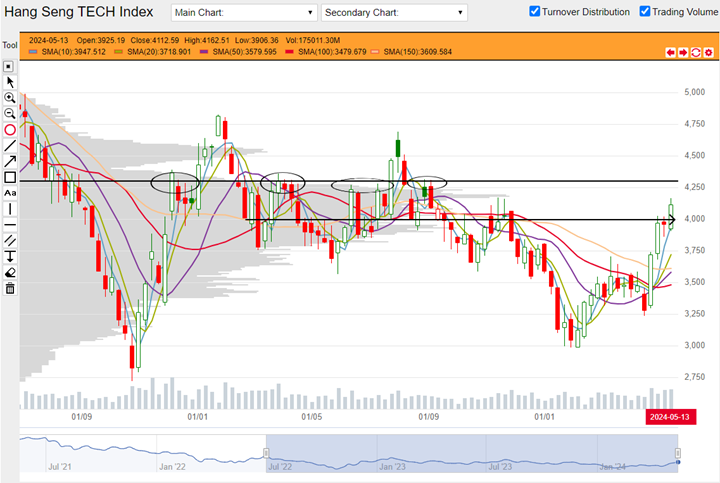
HSTech weekly chart from 04 July 2022 to 17 May 2024 (Source: DLC.socgen.com)
Nasdaq and the Dow printed new all-time-highs as the market bets that the Fed will cut rates soon.
The next FOMC meeting is scheduled on 12 June 2024.
Fed funds futures on rate hike probability by next Fed meeting as at this week’s close:
● 91.1% probability of no change |8.9% probability of 25 basis points cut
Fed funds futures on rate hike probability by next Fed meeting at last week’s close:
● 96.5% probability of no change |3.5% probability of 25 basis points cut
Probabilities on the CME Fedwatch Tool indicate no more rate hikes for this year but also indicate possibility for rates to stay at current level until April next year. Probabilities predict up to 125 basis points cut for the whole of 2024 and up to 175 basis points between now till April 2025.
Both Shanghai and Shenzhen closed positive for the week near to their year-to-date highs although no new high was printed since last week. This could be a consolidation pattern. Both indices closed above their respective basket of moving averages. It is a setup associated with further gains.
Other news:
● AIA, Kuaishou and Wuxi Bio bought back shares.
● China Construction Bank, China Mobile, Cosco Shipping, PetroChina and Xiaomi printed new 52-week highs.
● BYD launched its new hybrid pickup truck in Mexico.
● Industry Minister Kacir of Turkey said the country is in advanced talks with BYD and Chery Automobile to set up EV factories.
● SCMP reported that Kuaishou is looking to expand into the Middle East, North Africa, Brazil and Southeast Asia.
● Ganfeng Lithium will buy out its JV in Inner Mongolia Anda New Energy Technology.
● A revised version of the Biosecure Act in the US placed Wuxi Biologics into a list of entities of concern.
● Xiaomi has reportedly already sold 10000 vehicles in two months.
Technical observations
Baidu 9888.hk ascending in bullish pattern.
Note chart features:
1. In this chart from mid-July till April this year, Baidu was visibly descending in a series of lower highs and lower lows. This pattern is also visualized in the number of moving averages that were trending lower. This pattern appears to be broken this month. We can see that in the recent three weeks, a higher high was formed. This could be a bullish reversal pattern and the start of a new trend. This week’s close also took Baidu’s stock price above $110 which was previously a turning point with a number of swing highs and swing lows to its credit. Baidu is now trading above its entire basket of moving averages. This is a setup associated with further gains.
2. Apart from $110, the next prominent level to look out for could be $120. This level can also be associated with a number of previous swing highs and lows (see top row of circles).
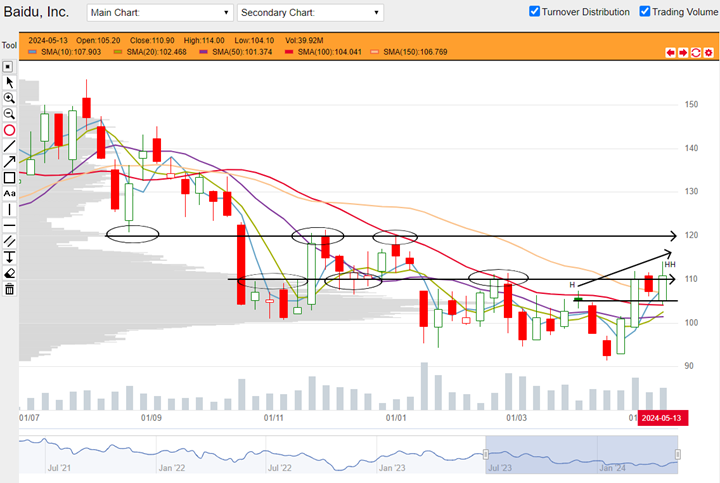
Baidu 9888.hk weekly chart from 03 July 2023 to 17 May 2024. (Source: DLC.socgen.com)
Brought to you by SG DLC Team
This advertisement has not been reviewed by the Monetary Authority of Singapore. This advertisement is distributed by Société Générale, Singapore Branch. This advertisement does not form part of any offer or invitation to buy or sell any daily leverage certificates (the “DLCs”), and nothing herein should be considered as financial advice or recommendation. The price may rise and fall in value rapidly and holders may lose all of their investment. Any past performance is not indicative of future performance. Investments in DLCs carry significant risks, please see dlc.socgen.com for further information and relevant risks. The DLCs are for specified investment products (SIP) qualified investors only.
Full Disclaimer - here