Market Commentary - For the week ending 3 May 2024
Market Commentary (Hong Kong)
For the week ending 03 May 2024
USDJPY closed as a bearish engulfing candle in the weekly chart on suspected BOJ intervention; the Yen traded at a high of 160.2 this week. WTI and Brent Crude dropped over 6%.
● Tesla shares jumped after Musk’s visit to Beijing. The company made a deal with Baidu to collect data on local roads for navigation. Additionally the Chinese regulator included Tesla’s Model 3 and Y in a list of vehicles that met requirements for data safety.
● The Biden Administration unveiled new anti-Russia sanctions that include China and Hong Kong companies.
● AstraZeneca admitted for the first time in a courtroom that its Covid vaccine can cause blood clotting and thrombosis.
● Apple announced a record-breaking $110 billion share buyback.
● Indonesia and Saudi Arabia reportedly warned the EU not to confiscate Russian assets at a recent G20 meeting.
Hang Seng Index closed this week at 18476, up 825 points or 4.67%. The index’s two-week rally coincided with gains by the HKD against the USD. It is possible that we are looking at fund flow from Wall Street to Asia as US indices continue to weaken. Since 17000 was overtaken, the market would be looking for the next prospective level. 18000 (already overtaken), 20000 and 22000 are all potentials. As can be seen in this chart going back to the opening of 2022, 20000 and 22000 are both levels where previous swing highs and swing lows can be spotted.
The index closed above its moving averages which is a setup associated with further gains. These are converging so a number of golden crosses could be expected in the near future. A throwback in the index is also possible.
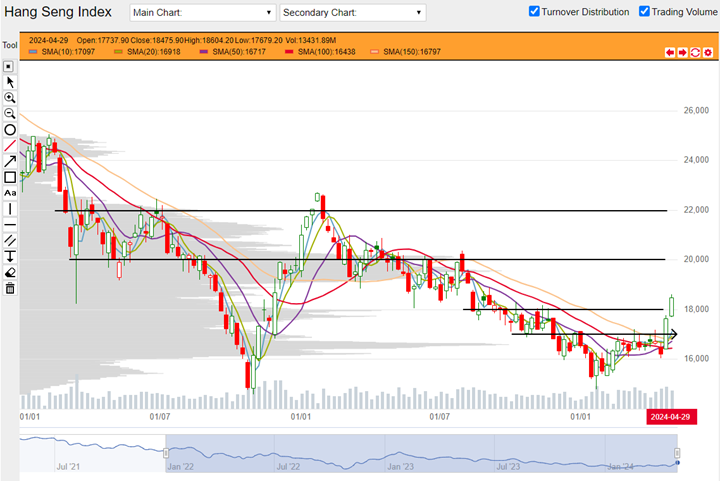
HSI weekly chart from 03 January 2022 to 03 May 2024 (Source: DLC.socgen.com)
Hang Seng Tech closed the week at 3971, up 253 points or 6.8%. It is harder to spot potential resistance or turning points for HSTech since previous swing highs did not stop at prominent levels. That the index stopped just shy of 4000 this week could be a nod to 4000 as a level. Observation of the gray horizontal histogram at left which indicates turnover distribution suggests that levels of prominent activity (see horizontal black lines) could be around 4200 and just above 4500. HSTech closed above its moving average indicators. This is a setup associated with further gains.
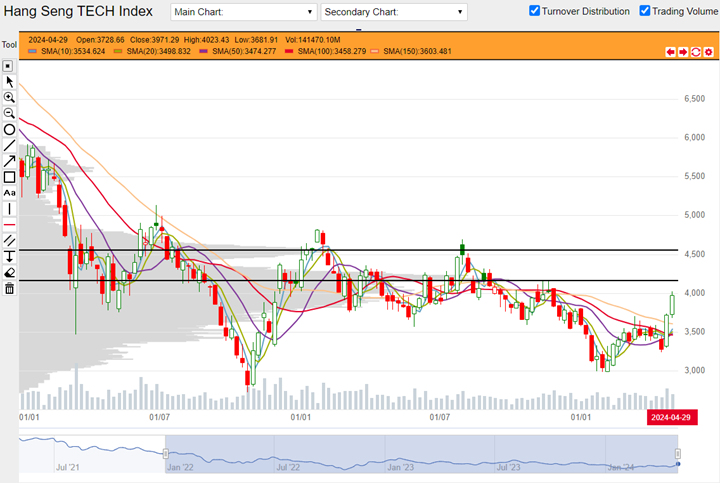
HSTech weekly chart from 03 January 202 to 03 May 2024 (Source: DLC.socgen.com)
Both the Dow and Nasdaq jumped to end the week at their respective 50-Day SMAs. Most gains were made on Friday which could be driven by a combination of sentiment from Apple’s massive share buyback, short squeezing and the huge underperformance from NFP numbers. The Fed held its policy rates unchanged.
The next FOMC meeting is scheduled on 12 June 2024.
Fed funds futures on rate hike probability by next Fed meeting as at this week’s close:
● 91.8% probability of no change |8.2% probability of 25 basis points cut
Fed funds futures on rate hike probability by next Fed meeting at last week’s close:
● 97.6% probability of no change |2.4% probability of 25 basis points cut
Probabilities on the CME Fedwatch Tool indicate no more rate hikes for this year but also indicate possibility for rates to stay at current level until April next year. Probabilities predict up to 125 basis points cut for the whole of 2024 and up to 175 basis points between now till April 2025.
Both Shanghai and Shenzhen had a short week because of the May golden week holidays. Both closed positive. Shanghai index made a new year-to-date high.
Other news:
● BYD and Meituan bought back shares.
● CNOOC printed a new 52-week high.
● Tesla will partner with Baidu for the former’s driver mapping and navigation system in China. China has already given in-principle approval.
● It was reported that Xiaomi received over 88000 orders for its EV.
Technical observations
BYD 1211.hk rose above a consolidation pattern, closed under trendline.
Note chart features:
1. BYD spent seven weeks consolidating in a sideways range while being supported by the 50-Day SMA (purple) and resisted by the 150-Day SMA (yellow). It broke out of this consolidation this week.
2. There is a downward trendline connecting two previous swing highs that go back to the middle of 2022. BYD closed just shy of this trendline which could be an acknowledgement to its presence.
3. BYD closed above its entire basket of moving average indicators. This setup is associated with further gains.
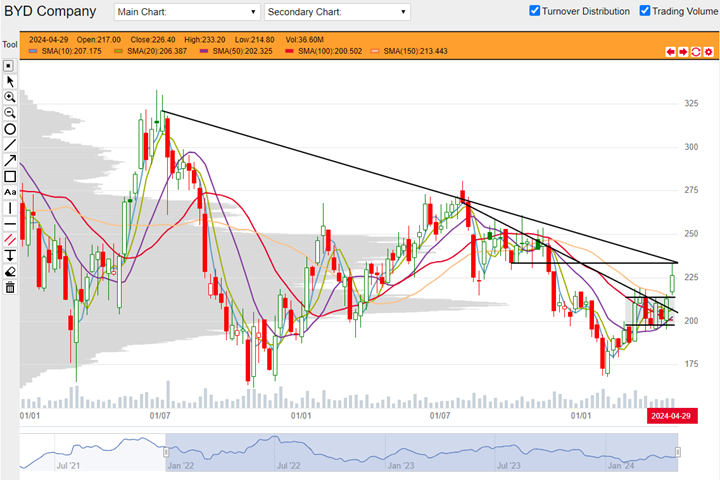
BYD 1211.hk weekly chart from 03 January 2022 to 03 May 2024. (Source: DLC.socgen.com)
Brought to you by SG DLC Team
This advertisement has not been reviewed by the Monetary Authority of Singapore. This advertisement is distributed by Société Générale, Singapore Branch. This advertisement does not form part of any offer or invitation to buy or sell any daily leverage certificates (the “DLCs”), and nothing herein should be considered as financial advice or recommendation. The price may rise and fall in value rapidly and holders may lose all of their investment. Any past performance is not indicative of future performance. Investments in DLCs carry significant risks, please see dlc.socgen.com for further information and relevant risks. The DLCs are for specified investment products (SIP) qualified investors only.
Full Disclaimer - here