Daily Leverage Certificates
DLC Hotline: (65) 6226 2828
Market Commentary (Hong Kong)
For the week ending 15 March 2024
The yield on US 10-year treasury bonds made its biggest weekly gain year-to-date. It closed at 4.31%. This is also the highest end-of-week close since the beginning of this year.
● According to Bloomberg, China’sNational Integrated Circuit Industry Investment Fund is expected to collect up to CNY 200 billion to power semiconductor and AI projects.
● According to South Korean SNE Research, global market share for batteries is dominated by CATL, BYD and LG. CATL and BYD numbers continued to improve in January 2024 on a y-o-y basis.
● The US House of Representatives passed a bill that required ByteDance to sell TikTok or be banned from the US. TikTok could mount a legal challenge.
● According to the FT, Malaysia is the top supplier of microchips to the US in 2023. The State of Penang attracted $12.8 billion in FDI in the year 2023 which surpassed the cumulative amount between 2013 - 2020.
● Samsung, LG and SK suspended their construction projects in the US amid rising costs and uncertain outlook.
● The Houthis in Yemen announced that they will attack Israel-linked ships even if they sail towards the Cape of Good Hope. Targets include those sailing in the Indian Ocean.
● Mercedes-Benz CEO Ola Källenius urged the European Union to lower tariffs, saying competition by Chinese car makers will drive European quality over time.
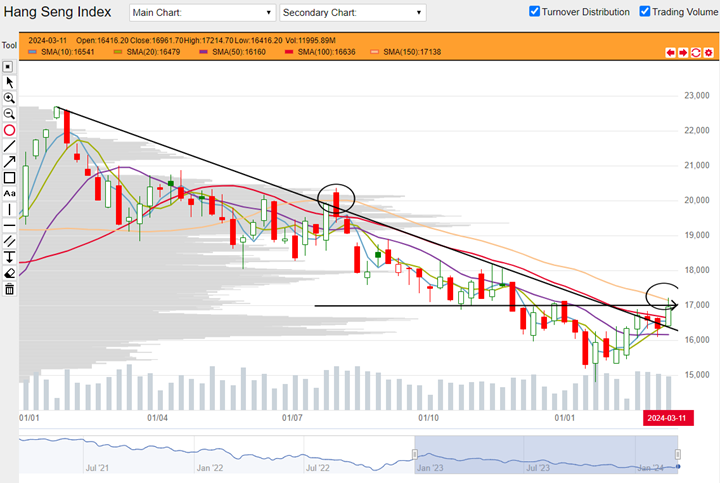
Hang Seng Index closed this week at 16721, up 368 points or 2.25%. A number of prominent features can be observed. First, HSI has broken a long downward trendline based on highest end-of-week closes. Breaking a downward trendline need not point to immediate reversal but could be a sign that the downward trend is over. Second, price action this week suggests that HSI could be resisted by the 150-Day SMA (yellow) see right bottom circle. Resistance by this indicator has precedence. The same price action also suggests that HSI could be resisted by 17000. This level has seen some swing highs and swing lows reversing here in the past six months. Support could come from the 10- and 20- Day SMAs.

HSI weekly chart from 02 January 2023 to 15 March 2024 (Source: DLC.socgen.com)
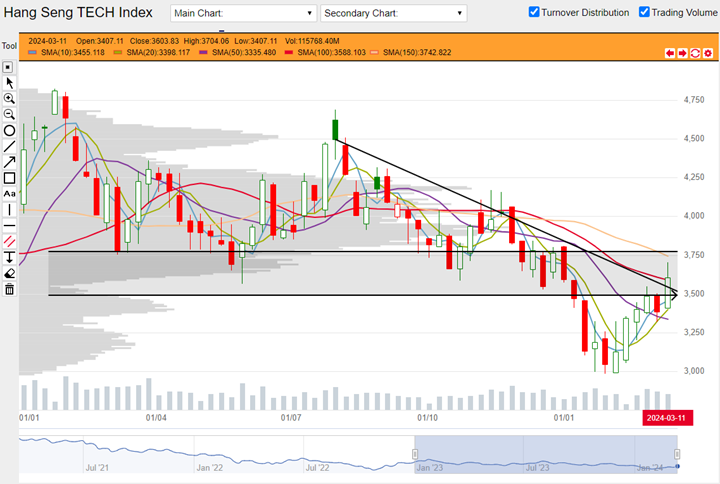
Hang Seng Tech closed the week at 3550, up 164 points or 4.85%. The following features can be observed. Last week HSTech was possibly resisted by 3500 and formed a potential double bar reversal. This potential reversal was averted this week as price breached 3500 and closed at a new week-to-week high. Price action suggests acknowledgement to the 100-Day SMA (red) as a potential resistance, with the long overhead tail this week. Price also encountered a potential resistance zone between 3500 and 3750. An inspection of this zone highlighted by the gray zone between two horizontal lines reveal multiple swing highs and lows and u-turned at or inside this zone. Lastly, HSTech also broke a downward trendline like what HSI did. No prominent reversal pattern can be observed. Setup for longer moving averages are still associated with further losses.

HSTech weekly chart from 02 January 2023 to 15 March 2024 (Source: DLC.socgen.com)
Nasdaq closed down for the second week since last week’s top. Dow closed up from open slightly but is still below last week’s close. Both indices are below their 10- and 20-Day SMAs. While the broad trend for both do not display any reversal pattern, it is possible that the 10- and 20-Day SMAs indicate that a short term top is in place.
The next FOMC meeting is scheduled on 20 March 2024.
Fed funds futures on rate hike probability by next Fed meeting as at this week’s close:
● 98.0% probability of no change |2.0% probability of 25 basis points cut
Fed funds futures on rate hike probability by next Fed meeting at last week’s close:
● 97.0% probability of no change |3.0% probability of 25 basis points cut
Probabilities on the CME Fedwatch Tool indicate no more rate hikes for this year but also indicate possibility for rates to stay at current level until March next year. Probabilities predict a cumulative 150 basis points cut for the whole of 2024 and up to 200 basis points between now till March 2025.
Shanghai closed the week at 3055, up 9 points or 0.28%. Shenzhen closed at 9613, up 57 points or 0.60%. Both indices made year-to-date new highs so for the short run, their setups appear to be associated with further gains. However long term moving averages for both are still descending.
Other news:
● AIA and Kuaishou bought back shares.
● Petrochina printed a new 52-week high. Wuxi Biologics printed a new 52-week low.
● Xiaomi announced that it will start delivering its first EV model from 28 March. It has 59 stores in 29 cities nationwide.
● Wuxi AppTec announced that it was ending its membership in the Washington-based Biotechnology Innovation Organization.
Technical observations
Xiaomi 1810.hk broke a prominent level on high volume.
Note chart features:
1. $13.60 is a prominent ceiling over the past four weeks. Along this level, one can spot multiple turning points going back to 2022. This could be a potential support-resistance level. Xiaomi was trading just below this level for the past four weeks. Price broke above this level this week on high volume. A piece of positive news that the company was delivering its SUV7 vehicle could be the driver for this price movement.
2. Xiaomi is trading above its moving average indicators 10-, 20-, 50- and 150-Day SMAs. The 100-Day might or might not be a potential resistance but the observation is that it is ascending and therefore in line with the bullish observations made above.

Xiaomi 1810.hk weekly chart from 03 January 2022 to 15 March 2024. (Source: DLC.socgen.com)
Underlying Index/Stock |
Underlying Chg (%)1 |
Long DLC (Bid Change%2) |
Short DLC (Bid Change%2) |
|---|---|---|---|
| Hang Seng Index (HSI) | -1.10% | ZOGW (-7.06%) | VXRW (+4.69%) |
| Hang Seng TECH Index (HSTECH) | -2.91% | UMCW (-17.65%) | HKRW (+17.49%) |
| Xiaomi Corporation (1810.HK) | -3.55% | XPKW (-9.24%) | LQEW (+11.99%) |
Brought to you by SG DLC Team
This advertisement has not been reviewed by the Monetary Authority of Singapore. This advertisement is distributed by Société Générale, Singapore Branch. This advertisement does not form part of any offer or invitation to buy or sell any daily leverage certificates (the “DLCs”), and nothing herein should be considered as financial advice or recommendation. The price may rise and fall in value rapidly and holders may lose all of their investment. Any past performance is not indicative of future performance. Investments in DLCs carry significant risks, please see dlc.socgen.com for further information and relevant risks. The DLCs are for specified investment products (SIP) qualified investors only.
Full Disclaimer - here