Daily Leverage Certificates
DLC Hotline: (65) 6226 2828
Unhappiness with Switzerland grew after UBS’s takeover of Credit Suisse created ugly precedents. The Fed hiked 25 basis points. Macron’s government narrowly survived a no-confidence vote; there is widespread civil unrest in France. German unions go on strike as the country braces for transportation shutdown.
● AT1 bondholders were wiped out by the UBS-Credit Suisse deal; shareholders did not get to vote.
● Evergrande winding-up petition delayed till end-July.
● HK 4Q ‘22 real GDP slides 4.2%; service activities down.
● Central Bank of Indonesia to phase out Visa and Mastercard, to be replaced with a local payment system.
● Saudi Arabia cuts its holdings in US bonds to the lowest in seven years.
● PBOC issued 5b worth of bills in Hong Kong, over six times subscribed.
● International capital flees the US and Europe, seeks safe haven in Hong Kong and Singapore; banks said to operate over weekends to service account openings.
● Deutsche Bank stock back in focus.
● France, Germany and UK Manufacturing PMI contract.
● US Treasury Sec Yellen convened an emergency meeting of the Financial Stability Oversight Council.
Hang Seng Index closed this week at 19916, up 397 points or 2.03%. End-of-week candlestick pattern qualifies for a bullish engulfing candle. It is likely the HSI has found support from 19300 as well as the combination of 100 and 150 Day SMAs converging below. Note that both moving averages also show a golden cross. For more confirmation of a swing low here, look for HSI to close above 20k. Note that there is a left-right symmetry if we draw a vertical line through last year’s October low. This symmetry suggests the possibility of a larger inverted head and shoulders reversal.
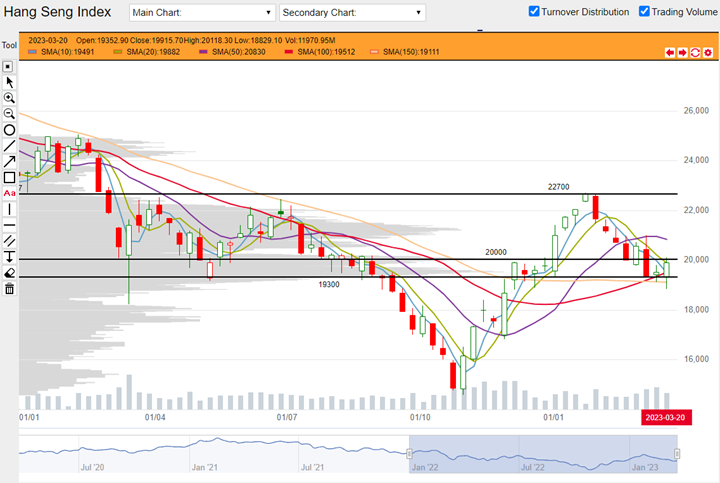
HSI weekly chart from 03 January 2022 to 24 March 2023 (Source: DLC.socgen.com)
Hang Seng Tech closed the week at 4225, up 245 points or 6.16%. The end-of-week candle is a big bullish candle that has clearly expanded above 4120 and above both 10 and 20 Day SMAs. Overhead it is resisted by 50 Day SMA (purple). There could be some volatility including a possible throwback to retest 4120 but there are more elements that provide support than those that resist. As with the HSI, there is a left-right symmetry that suggests the potential for an inverted head and shoulders reversal to emerge.
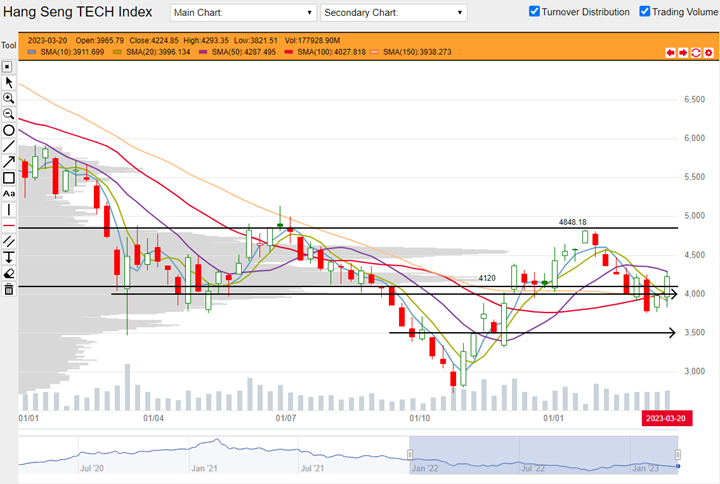
HSTech weekly chart from 03 January 2022 to 24 March 2023 (Source: DLC.socgen.com)
Dow Jones Industrial Average closed at 32238, up 376 points or 1.18%. Nasdaq closed at 12767, up 247 points or 1.97%. Despite its bullish close, DJI was not convincing. Its short term momentum is downward with its 10 Day SMA leading the drop. This week’s bullish move did not convincingly close above the 10 Day so appears that the downtrend remains intact. Nasdaq is more bullish and even made a new year-to-date high. With this whole week’s action above its entire basket of moving averages, Nasdaq’s setup is associated with further gains.
The next FOMC meeting is scheduled on 03 May 2023.e steadily since the last but this trend was reversed this week possibly by trouble in the banking and finance sector.
Fed funds futures on rate hike probability by next Fed meeting as at this week’s close:
● 88.2% probability of no change | 11.8% probability of 25 basis points hike
At this moment, markets are expecting probabilities of a maximum 25 basis points hike for the rest of 2023. This hike could come in May or latest by June. Probabilities also indicate that from the July meeting, the Fed will cut rates by 25 basis points at each FOMC until the rest of the year.
Shanghai Composite closed the week at 3266, up 15 points or 0.46%. Shenzhen Index closed at 11634, up 356 points or 3.16%. The Shanghai index continues to trade sideways. While it appears to be at a swing high, it continues to trade above Q4 ‘22 high. In the meantime, the index trades between its 10, 20 and 50 Day SMAs. Just from candlesticks, the Shenzhen Index appears to have completed a retracement from its high in late-January and this week’s bullish expanding candle could be a signal that a swing low is in. Look at Q4 ‘22 high to be a pivot point. At this week’s close, this could turn out to be a support level. Moving averages are messy and offer little persuasion for any direction.
Economic data in coming week:
1. Tuesday 28 March 2023 BOE Governor Bailey to speak.
2. Tuesday 28 March 2023 US reports CB Consumer Confidence.
3. Thursday 30 March 2023 Germany reports preliminary CPI.
4. Thursday 30 March 2023 US reports q-on-q GDP and Unemployment Claims.
5. Friday 31 March 2023 China reports PMI.
6. Friday 31 March 2023 Treasury Sec Yellen to speak.
7. Friday 31 March 2023 US reports Core PCE Price Index.
Other news:
● AIA and CK Asset bought back shares.
● China Mobile made a new 52-week high.
● Baidu’s Ernie-Bot cloud service to roll out on 27 March 2023.
● Tencent applied for a patent for a palm and face authentication system.
● Baidu’s smart car business receives approval to test autonomous cars in Shanghai.
● AIA applies to launch a RMB counter.
● Alihealth to start registering people to take CSPC Pharmaceutical’s Covid mRNA vaccine.
Technical observations
HKEX 388.hk long term moving averages print golden cross, potential swing low in place at previous support.
Note chart features:
1. HKEX has clearly defined potential supports between $318 - 327 and potential resistance from $379 - 386 based on observation of previous swing highs and swing lows.
2. The stock sat on potential support for four weeks before making a bullish expansion this week. This four-week action is a nod to the support in place and expansion suggests that previous downswing could be over.
3. Long term moving averages 100 and 150 Day SMAs (red and yellow) printed a golden cross. This is a technical signal that the previous downtrend is over.
4. HKEX has a left-right symmetry based on a vertical line cutting through last year’s October low. This hints at a potential inverted head and shoulders’ reversal chart pattern.
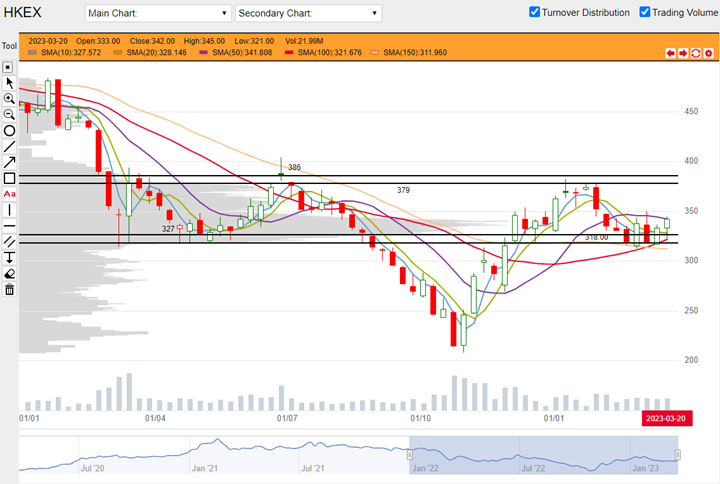
HKEX 388.hk weekly chart from 03 January 2022 to 24 March 2023 (Source: DLC.socgen.com)
Tencent 700.hk long term moving averages print golden cross, bullish expansion week.
Note chart features:
1. Tencent’s potential support lies between $304 - 332 and resistance between $396 - 415 based on previous swing highs.
2. The stock made a three candle reversal pattern and this week’s candle is a huge expansion, engulf’s last week’s candle. At week’s close, the stock is above its entire basket of moving averages. This is a setup for further gains.
3. 100 and 150 Day SMAs (red and yellow) printed a golden cross which signals that its previous downtrend is over. There is a left-right symmetry that hints the potential for an inverted head and shoulders’ reversal pattern.
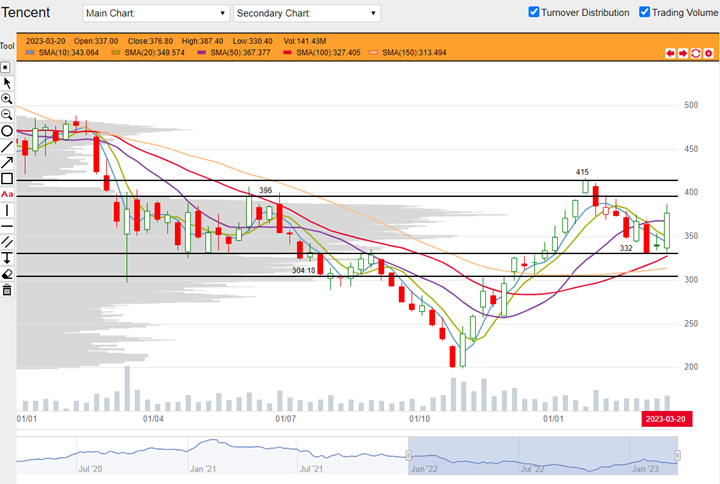
Tencent 700.hk weekly chart from 03 January 2022 to 24 March 2023 (Source: DLC.socgen.com)
Underlying Index/Stock |
Underlying Chg (%)1 |
Long DLC (Bid Change%2) |
Short DLC (Bid Change%2) |
|---|---|---|---|
| Hang Seng Index (HSI) | -1.87% | CVMW (-7.71%) | WIEW (+11.72%) |
| Hang Seng TECH Index (HSTECH) | -3.26% | UMCW (-20.83%) | YVRW (+18.00%) |
| HKEX (0388.HK) | -2.70% | ENTW (-12.39%) | |
| Tencent (0700.HK) | -2.22% | ZS6W (-9.26%) | 9VHW (+12.87%) |
Brought to you by SG DLC Team
This advertisement has not been reviewed by the Monetary Authority of Singapore. This advertisement is distributed by Société Générale, Singapore Branch. This advertisement does not form part of any offer or invitation to buy or sell any daily leverage certificates (the “DLCs”), and nothing herein should be considered as financial advice or recommendation. The price may rise and fall in value rapidly and holders may lose all of their investment. Any past performance is not indicative of future performance. Investments in DLCs carry significant risks, please see dlc.socgen.com for further information and relevant risks. The DLCs are for specified investment products (SIP) qualified investors only.
Full Disclaimer - here