Daily Leverage Certificates
DLC Hotline: (65) 6226 2828
US bank failures are in the news after Silicon Valley Bank and Signature Bank were taken over by FDIC and regulators. HSBC takes over the UK arm of Silicon Valley Bank for £1. Credit Suisse reveals flaws in FY21 and FY22 financial statements; top shareholder Saudi National Bank refuses to inject further funds. DXY could be making a swing high resisted by 100 Day SMA. WTI made a new 52-week low, closed at $66.22.
● Chinese small and medium enterprises post expansion in activity from 88.9 in January 2023 to 89.6 in February.
● Silicon Valley Bank has branches in Canada, Denmark, Germany, India, Israel, Sweden and China.
● More than 20 companies listed in China and Hong Kong issued statements stressing that the impact of SVB on their operations is limited.
● China EximBank and Saudi National Bank announced their first loan cooperation in Yuan.
● The US threatened to ban TikTok if owners do not sell their stake.
● First China-Europe freight train departed Beijing for Moscow carrying auto parts, apparel and home appliances. The train will arrive in 18 days.
● Cathay Pacific’s passenger load in February increased 34.67 times year-on-year. Cargo carried increased 59.6%.
● The Swiss government intends to merge Credit Suisse and UBS.
● PBOC announced a reduction in reserve-requirement ratio (RRR) for financial institutions by 25 bps from 27 March.
● China continues to reduce its holdings of US Treasuries. Based on data on 15 March 2023, China is holding on to $859.4 billion in Treasury securities.
Hang Seng Index closed this week at 19519, up 199 points or 1.03%. This week’s Doji candlestick close could be evidence from price action that 19450 is a valid support level. The same price action is also a nod to support from the 100 and 150 Day SMAs (red and yellow). While bulls could be looking at this combination, bears could be focused on resistance from 20000 as well as 10 and 20 Day SMAs overhead. As investors worry about contagion from banking risk, volatility could persist.
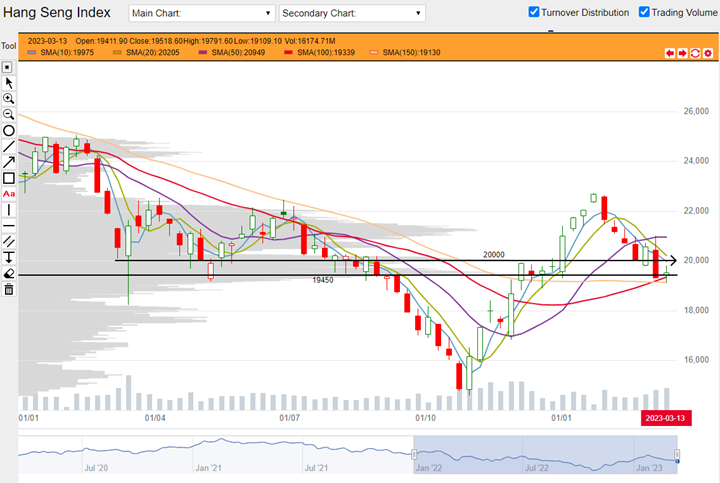
HSI weekly chart from 03 January 2022 to 17 March 2023 (Source: DLC.socgen.com)
Hang Seng Tech closed the week at 3980, up 198 points or 5.22%. Compared to HSI’s Doji candle which represents uncertainty, HSTech’s solid candle is more decisively bullish. However, by closing below both 4000 and 4120 levels, these are likely to switch to potential resistance. Besides these levels, there is a congestion of four moving averages namely the 10, 20, 100 and 150 Day SMAs. Based on this week’s close below, these indicators are more likely to act as resistance.
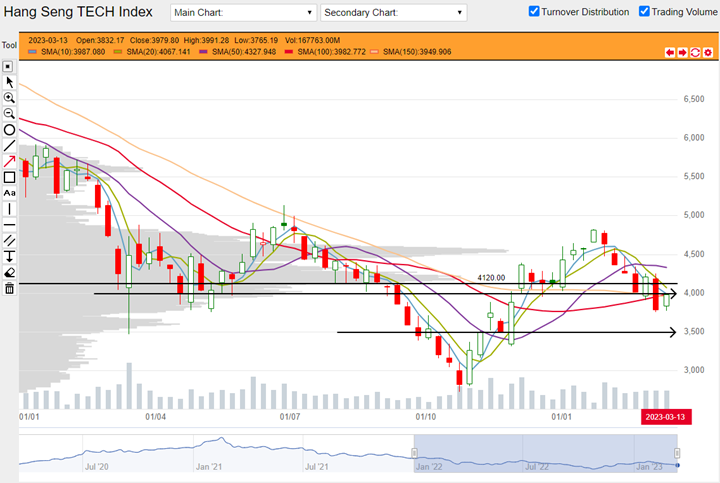
HSTech weekly chart from 03 January 2022 to 17 March 2023 (Source: DLC.socgen.com)
Dow Jones Industrial Average closed at 31862, down 48 points or 0.15% for the week. Actions from the Fed and Treasury temporarily stabilized the market but the best the index could do was to close the week as a Doji. However it closed below its entire basket of moving averages which is a setup associated with further losses. Loss leaders are Goldman Sachs and Caterpillar. Market focus is likely on the FOMC meeting next week, especially the following press conference. Nasdaq closed at 12520, up 690 or 5.83%. This is a bullish expansion and the highest end-of-week close in six weeks. Gain leaders are AMD and Intel. Nasdaq is trading above its moving averages so this is a divergence from the Dow.
The next FOMC meeting is scheduled on 22 March 2023. Probability of a 50 basis point hike rose steadily since the last but this trend was reversed this week possibly by trouble in the banking and finance sector.
Fed funds futures on rate hike probability by next Fed meeting as at last DLC commentary on 03 March:
● 60.5% probability of 25 basis points rate hike | 39.5% probability of 50 basis points hike
Fed funds futures on rate hike probability by next Fed meeting at this week’s reading:
● 38.0% probability to stay put | 62% probability of 25 basis points rate hike
Odds of rate hikes for the rest of the year have collapsed. The market is betting on a maximum of only two rate hikes of 25 points each for the year, one at the coming meeting and one more in May. Based on these odds, rates will top at 5.25 in May followed by cuts in June. Rates could fall to 3% by December.
Shanghai Composite closed the week at 3251, up 20 points or 0.63%. Shenzhen Index closed at 11278, down 164 points or 1.44%. With last week’s price action and today’s end-of-week close, we could be looking at a swing high in the Shanghai Composite on the weekly chart with further losses ahead. For now, Shanghai Composite is sitting on the 50 Day SMA as well as support from Q4 ‘22 high. Should this index fall below these, look for potential support from 100 and 150 Day SMA. Shenzhen Index closed below its entire basket of moving averages. This setup is associated with further losses. Look for potential support from 11000. 11003 is the Shenzhen Index’s opening level for the year.
Economic data in coming week:
1. Wednesday 22 March 2023 UK reports CPI y-on-y.
2. Thursday 23 March 2023 look for FOMC statement and press conference. On the same day, look also for SNB monetary policy, press conference followed by BOE monetary policy.
3. Friday 24 March 2023 France, Germany, UK and US reports Services and Manufacturing PMI.
Other news:
● AIA bought back shares.
● Ganfeng Lithium makes new 52-week low; China Mobile makes new 52-week high.
● Tesla stopped using BYD batteries for affordable models.
● BYD held a brand and new vehicle launch event in Jordan as part of Middle East penetration.
● Anta Sports applied to HKEX for a new RMB counter.
● Chinese media reported that over 30000 enterprise users applied for Baidu’s Ernie Bot Enterprise Edition API; Baidu Intelligent Cloud website saw 100-fold increase in traffic.
● Baidu Apollo received a permit to operate driverless vehicles in Beijing.
Technical observations
Lenovo 1772.hk at top of falling channel, volume declining.
Note chart features:
1. Lenovo is at the top of a downward parallel channel drawn from two swing lows and multiple swing highs. Based on price action this week and last, the stock appears to be reacting to and acknowledging the top of this channel.
2. Apart from the above mentioned parallel channel, there appears to be a potential resistance zone between $7.24 -7.69. This zone is drawn from swing lows in July, October and November 2021. What is notable is this week’s trading volume which shows a marked decline from last week. Such a decline could take the wind out of Lenovo’s sail.
3. Should Lenovo penetrate the current high, look for potential consolidation before advancing. Should the price top at the current level, look for potential support between $6.44 - 6.64 and coinciding with 50, 100 and 150 Day SMAs.
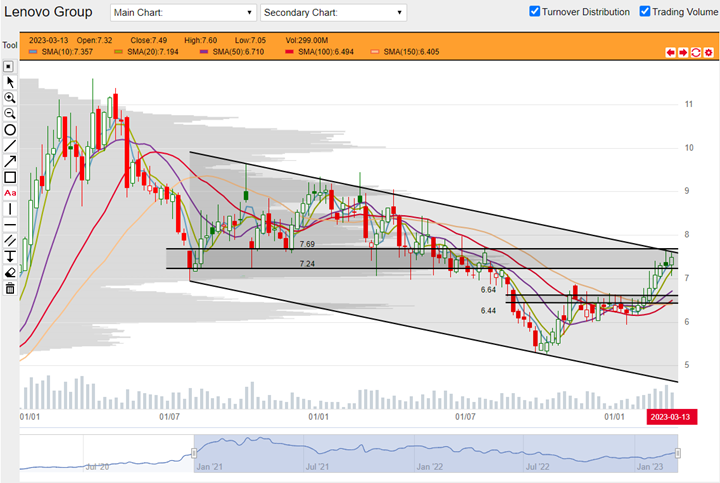
Lenovo 992.hk weekly chart from 03 January 2022 to 10 March 2023 (Source: DLC.socgen.com)
Bilibili 9626.hk clearly defined channel, rising volume.
Note chart features:
1. Bilibili could be making a swing low in a clearly defined channel. This channel was drawn from multiple swing lows and swing highs back in 2022. Price action over these past three weeks appear to react positively to the channel’s low. Overhead potential resistance lies between $220 - 224. Support lies between $147 - 158 as well as confluence from 100 and 150 Day SMAs.
2. The stock ended this week’s trading by closing above last week’s high. This is a positive feature. A second positive is this week’s increase in trading volume over last week. Increase in trading volume matching an expanding week candle bouncing from support is a triple-positive combination. 50 Day SMA overhead could dampen spirits however.
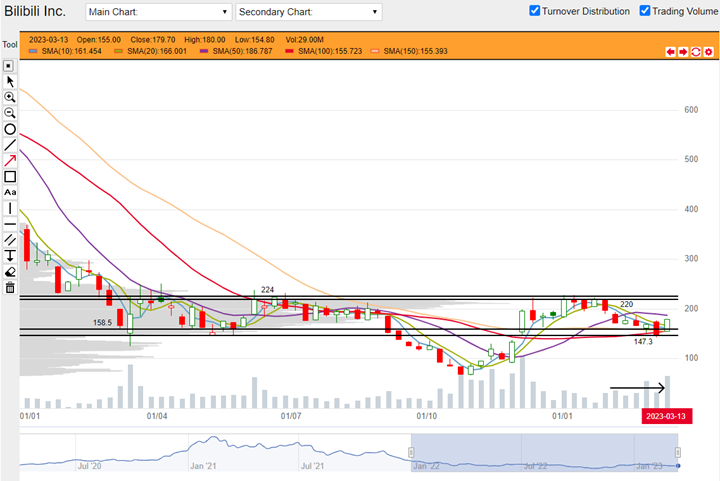
Bilibili 9626.hk weekly chart from 03 January 2022 to 17 March 2023 (Source: DLC.socgen.com)
Underlying Index/Stock |
Underlying Chg (%)1 |
Long DLC (Bid Change%2) |
Short DLC (Bid Change%2) |
|---|---|---|---|
| Hang Seng Index (HSI) | -1.87% | CVMW (-7.71%) | WIEW (+11.72%) |
| Hang Seng TECH Index (HSTECH) | -3.26% | UMCW (-20.83%) | YVRW (+18.00%) |
| Lenovo Group (0992.HK) | -1.97% | TDDW (-8.97%) | |
| Bilibili Inc. (9626.HK) | -3.14% | ODJW (-13.34%) |
Brought to you by SG DLC Team
This advertisement has not been reviewed by the Monetary Authority of Singapore. This advertisement is distributed by Société Générale, Singapore Branch. This advertisement does not form part of any offer or invitation to buy or sell any daily leverage certificates (the “DLCs”), and nothing herein should be considered as financial advice or recommendation. The price may rise and fall in value rapidly and holders may lose all of their investment. Any past performance is not indicative of future performance. Investments in DLCs carry significant risks, please see dlc.socgen.com for further information and relevant risks. The DLCs are for specified investment products (SIP) qualified investors only.
Full Disclaimer - here