Daily Leverage Certificates
DLC Hotline: (65) 6226 2828
● According to the Census and Statistics Department, Hong Kong’s January 2023 import and export numbers both recorded year-on-year decreases; retail sales for the same month increased 7% y-on-y.
● China to debut the Metaverse festival in April in Beijing, Shanghai and Guangzhou.
● Western chip makers and suppliers set up in Singapore to diversify their supply chain.
● China GDP increased 3% in 2022 according to the National Bureau of Statistics.
● Shanghai rolled out the development plan for Grand neoBay Sci-Tech Innovation Park, with over 1,000 high-tech enterprises expected to be settled by 2025.
● China Caixin Manufacturing PMI beats forecast, expands for first time since August 2022; official forecast hits 11-year high in February.
● Beijing continues subsidies for NEVs.
● Moody’s upped China’s economic growth for 2023- 2024 to 5%, expecting a US recession in the second half of this year.
● Macau’s betting revenue for February recorded a y-on-y uptick of 33% but m-on-m decline of 11%.
● IDC expects global smartphone shipments to decline in 2023, demand to be pushed to next year.
● China’s Guangdong Province vows to build an international financial hub in the Guangdong-Hong Kong-Macao Greater Bay Area (GBA).
● According to a report by China Real Estate Information Corp (CRIC), top 100 real estate developers’ sales grew 14.9% y-on-y.
● Australian Strategic Policy Institute reports that China leads globally in 37 out of 44 technologies.
Hang Seng Index closed this week at 20568, up 558 points or 2.79%. The index traded below 20000 on Monday and Tuesday but closed the week above. This is an indication that 20000 could be a valid support. There is another potential support below around 19450 to form a zone. Despite this week’s bullish close, price action does not resemble a bullish candlestick pattern. Short term moving average indicators 10 and 20 Day SMAs are still moving down so they could act as resistance next week. In addition the 50 Day SMA (purple) is also overhead.
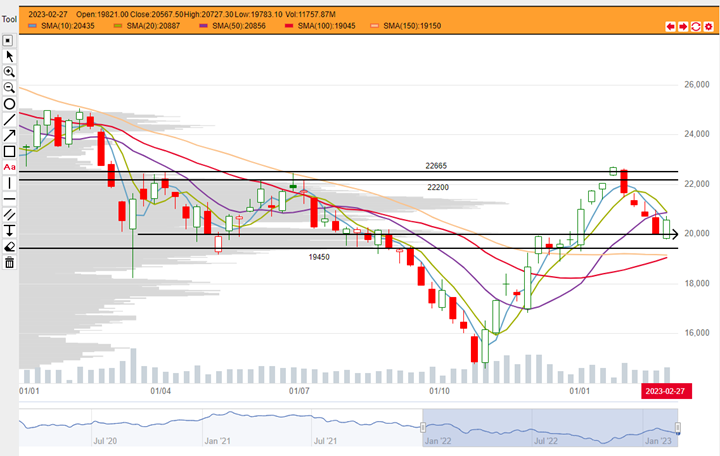
HSI weekly chart from 03 January 2022 to 03 March 2023 (Source: DLC.socgen.com)
Hang Seng Tech closed the week at 4211, up 201 points or 5%. HSTech has a confluence of potential support from levels 4000 and 4120 as well as 100 and 150 Day SMAs that are converging. This week’s action appears to be a bullish reaction to this confluence. Again, this week’s candle does not fit a conventional bullish pattern and short term moving averages are heading down. 10, 20 and 50 Day SMAs which are overhead could act as resistance next week.
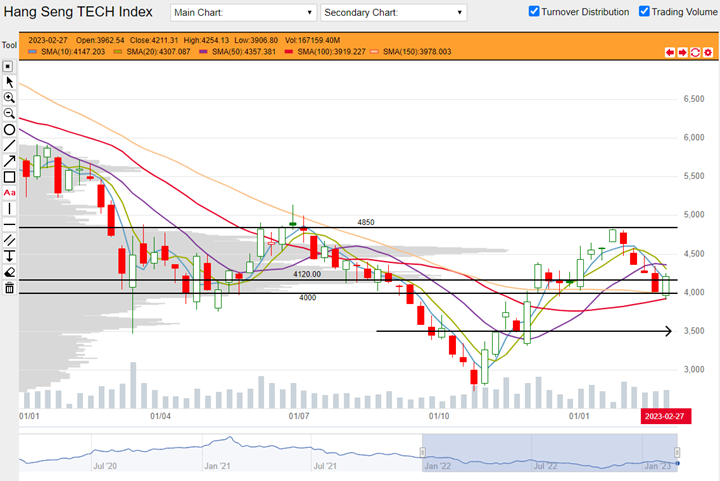
HSTech weekly chart from 03 January 2022 to 03 March 2023 (Source: DLC.socgen.com)
Dow Jones Industrial Average closed the week at 12291, up 321 points or 2.68%. Nasdaq closed the week at 33391, up 574 points or 1.75%. Despite the numbers, Nasdaq appears to be more bullish. Nasdaq closed above last week’s high in a clearly expanding week and supported by Q4 high. Prominently both indices appear to have rebounded from their rising 100 and 150 Day SMAs. This setup is signaling that both indices could be building base for more gains this year.
The next FOMC meeting is scheduled on 22 March 2023. Probability of a 50 basis point hike has risen steadily since the last three weeks. The market is betting that interest rates will hit 6% as early as this year’s July Fed meeting.
Fed funds futures on rate hike probability by next Fed meeting as at last DLC commentary on 24 Feb:
● 73.0% probability of 25 basis points rate hike | 27.0% probability of 50 basis points hike
Fed funds futures on rate hike probability by next Fed meeting at this week’s reading:
● 69.4% probability of 25 basis points rate hike | 30.6% probability of 50 basis points hike
Shanghai Composite closed the week at 3328, up 61 points or 1.87%. This is the highest end-of-week close year-to-date. Until Wednesday 01 March, the index was fighting a 5-week high but positive vibes from the second plenary session of the 20th CPC nudged the index up on Thursday and Friday. According to a previous swing high observed at the end of June 2022, potential resistance could be between 3390 to 3420 which suggests more room to gain. However market breadth might not be fully supportive. Friday’s trading session closed with 2272 winning stocks, 2669 losers and 243 unchanged. Shenzhen Index closed at 11852, up 64 points or 0.55%. Despite a bullish close, it is below its 10 and 20 Day SMAs.
Economic data in coming week:
1. Tuesday 07 March 2023 Fed Chair Powell testifies to the Senate Banking Committee.
2. Wednesday 08 March 2023 US reports ADP Non Farm Employment Change and JOLTS Jobs Openings. Fed Chair Powell testifies.
3. Thursday 09 March 2023 China reports CPI and PPI.
4. Friday 10 March 2023 BOJ Monetary Policy Statement and press conference.
5. Friday 10 March 2023 UK reports month-on-month GDP.
6. Friday 10 March 2023 US reports Average Hourly Earnings and Non-farm Payrolls.
Other news:
● Greatwall Motor and Sino Biopharm bought back shares.
● China Mobile made a new 52-week high.
● Amid reforms, HKEX will allow tech companies with no revenue or profit to list after a rule change in March.
● Huawei filed a lawsuit against Xiaomi for patent infringement on four technologies.
● Number of Internet users on China Mobile exceeds 1.2 billion.
● Kuaishou to launch a new online shopping mall in March according to media.
● Lenovo Chairman and CEO pared his stake down to 8.8%.
● Kuaishou Technology submitted an application for an additional RMB counter.
● Kingsoft Wuhan plans to invest into a joint fund with Xiaomi.
● Saudi Aramco plans to invest in a joint venture being planned by Geely and Renault.
● CNOOC discovered an oilfield in the Bohai Sea with an estimated 100 million tonnes of light crude.
● HKEX plans to open a London office and will expand Stock Connect eligible stocks from 13 March.
Technical observations
Hong Kong Exchange 388.hk closed the week with a Bullish Engulfing Candlestick Pattern.
Note chart features:
1. Price action for HKEX looks positive as it closed the week with a Bullish Engulfing Pattern. This is a bullish reversal pattern. The stock also closed above both its 10 and 20 Day SMAs. The 50 Day SMA is overhead which could act as resistance.
2. There is a support zone between $319.4 to $327.60m These are drawn from previous swing low of May 2022 and last week’s closing level. This support zone is reinforced by the 100 and 150 Day SMAs which are converging just below. Based on inspection, the 150 Day SMA (yellow) was touched on Monday and Tuesday this week but both days did not close below this indicator.
3. If we draw a vertical line down through the swing low late-October last year, we can see that there is a very nice left-right symmetry in the chart. This could be the basis for an Inverted Head and Shoulders pattern. This has to be confirmed by price action but at the moment the symmetry is prominent. A golden cross between the 100 and 150 Day SMAs would be further encouragement to look for consolidation followed by a higher high.
HKEX 388.
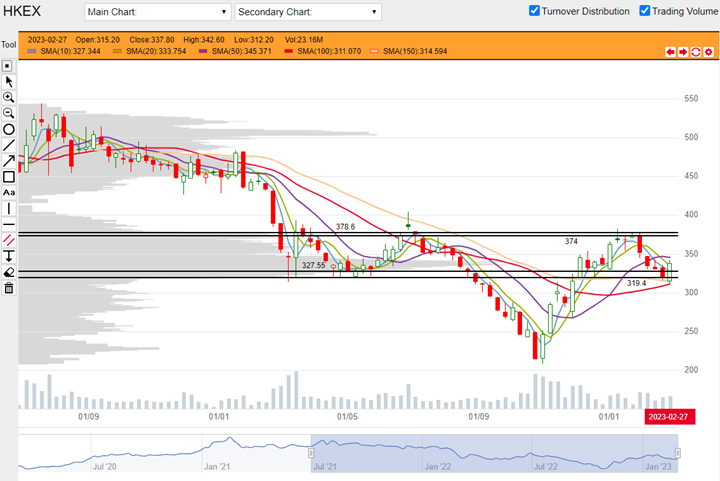
HKEX 388.hk weekly chart from 05 July 2021 to 03 March 2023 (Source: DLC.socgen.com)
Bilibili 9626.hk in prominent horizontal channel, high volume bullish week at support.
Note chart features:
1. A very prominent horizontal channel can be drawn based on previous swing highs and swing lows. Bilibili appears to conform to this channel closely. Top of the channel is $224.20 based on week close. Bottom is $158.50. This week’s bullish candle appears to acknowledge the bottom of the channel. Potential support here is also bolstered by 100 and 150 Day SMAs which are converging.
2. Although this week’s candle is bullish, it does not fit a reversal candle and the week’s close is below the 10 Day SMA. 10, 20 and 50 Day SMAs are overhead and could act as resistance. Therefore the price could continue to fall. Note that this week’s trading volume is very prominent. In conjunction with a bullish candle at support, this setup could be bullish.

Bilibili 9626.hk weekly chart from 03 January 2020 to 03 March 2023 (Source: DLC.socgen.com)
Underlying Index/Stock |
Underlying Chg (%)1 |
Long DLC (Bid Change%2) |
Short DLC (Bid Change%2) |
|---|---|---|---|
| Hang Seng Index (HSI) | -1.87% | CVMW (-7.71%) | WIEW (+11.72%) |
| Hang Seng TECH Index (HSTECH) | -3.26% | UMCW (-20.83%) | YVRW (+18.00%) |
| HKEX (0388.HK) | -2.70% | ENTW (-12.39%) | |
| Bilibili Inc. (9626.HK) | -3.14% | ODJW (-13.34%) |
Brought to you by SG DLC Team
This advertisement has not been reviewed by the Monetary Authority of Singapore. This advertisement is distributed by Société Générale, Singapore Branch. This advertisement does not form part of any offer or invitation to buy or sell any daily leverage certificates (the “DLCs”), and nothing herein should be considered as financial advice or recommendation. The price may rise and fall in value rapidly and holders may lose all of their investment. Any past performance is not indicative of future performance. Investments in DLCs carry significant risks, please see dlc.socgen.com for further information and relevant risks. The DLCs are for specified investment products (SIP) qualified investors only.
Full Disclaimer - here