Daily Leverage Certificates
DLC Hotline: (65) 6226 2828
FTSE 100 makes another new 52-week high, the sixth out of seven year-to-date. In the meantime, Dow Jones Industrial Average is again resisted by Q3 ‘22 for the sixth out of seven weeks. The Dollar Index DXY is now positive and up 0.37% year-to-date. USDJPY is also positive and up 2.43% over the same period.
● China’s January 2023 M2 supply ballooned 12.6% Y-on-Y compared to 11.6% forecast according to PBOC.
● Editorial in Global Times suggests China to set GDP at 6%, increase fiscal deficit to GDP ratio.
● Cathay Pacific Air announced that January 2023 passengers carried increased by 40.8x compared to January 2022. Cargo carried increased 28.1% over the same period.
● Production volume of all segments in the photovoltaic industry in China hit a record high in 2022 according to the Ministry of Industry and Information Technology.
● Based on data from the US Department of Treasury and the Federal Reserve Board, China’s holdings of US Treasuries shrink by USD 173.2 billion to USD 867.1 billion in 2022. Over the same period, Japan’s holdings fell by USD 224.5 billion to USD 1076.3 billion.
Hang Seng Index closed this week at 20720, down 471 points or 2.22%. 10 and 20 Day SMAs have crossed over bearishly so short term bear momentum is now likely in charge. Based on previous swing levels, resistance is between 22200 and 22665. Potential support could come in between 19450 to 20000. The index is now just above the 50 Day SMA (purple) so if this indicator provides support, we could see some back and forth action between the 50, the 10 and 20 Day SMAs. Overall, the entire basket of moving averages indicate that the previous downtrend from mid-2021 could be over. Last signal to expect from a reversal is a golden cross between the 100 and 150 Day SMAs (red and yellow). 100 and 150 Day SMA could provide support as well.
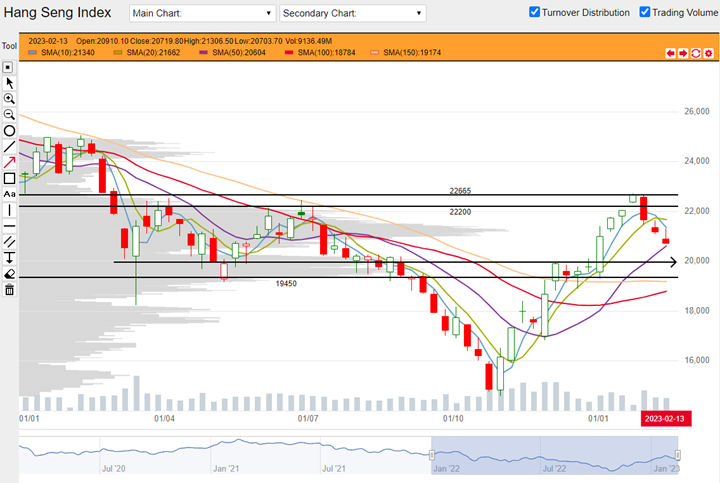
HSI weekly chart from 03 January 2022 to 17 February 2023 (Source: DLC.socgen.com)
Hang Seng Tech closed the week at 4247, down 471 points or 2.22%. HSTech closed the week below its 10, 20 and 50 Day SMAs. The 10 and 20 formed a dead cross so bearish momentum is likely in change. Previous swing high indicates resistance between 4800-4900 and this was confirmed by the top three weeks ago. Previous swing lows indicate potential support between 4000 and 4120. 100 and 150 Day SMAs are also likely to become support.
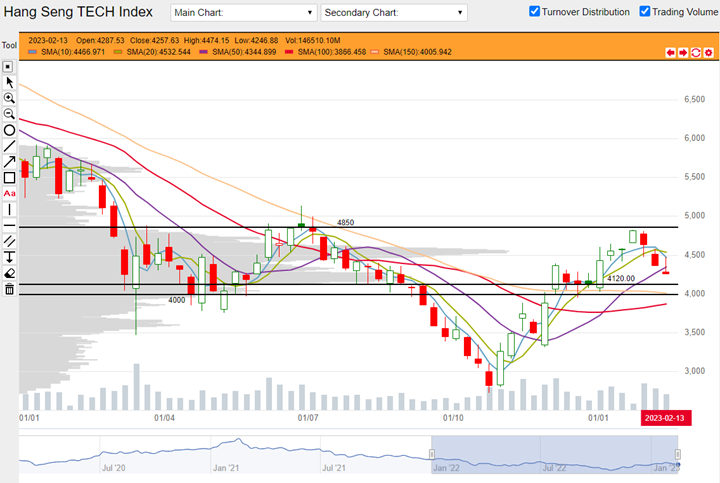
HSTech weekly chart from 03 January 2022 to 10 February 2023 (Source: DLC.socgen.com)
Dow Jones Industrial Average closed the week at 33827, down 43 points or 0.13%. Nasdaq closed at 12358, up 53 points or 0.43%. The Dow is resisted by Q3 2022 and was stuck under this level six out of seven weeks year-to-date. If the index does not break above this level, it is likely a swing top is forming here and that distribution could be taking place. On the other hand Nasdaq has broken above its Q4 2022 high so this level could become a base for further gains.
The next FOMC meeting is scheduled on 22 March 2023. Probability of a 50 basis point hike has risen steadily since the last three weeks.
Fed funds futures on rate hike probability by next Fed meeting as at last DLC commentary on 10 Feb:
● 90.8% probability of 25 basis points rate hike | 9.2% probability of 50 basis points hike
Fed funds futures on rate hike probability by next Fed meeting at this week’s reading:
● 81.9% probability of 25 basis points rate hike | 18.1% probability of 50 basis points hike
Both Shanghai Composite and Shenzhen Index are more bullish than their HK counterparts. Both indices made some intraweek attempt to retry their recent highs. 10 and 20 Day SMAs for both also have not formed any dead cross. With this week’s close however, it is reasonable to observe both indices have made swing tops at their respective levels over the past four weeks. Both indices could correct further why looking for support. Shanghai Composite closed at 3224, down 37 points or 1.12%. Shenzhen closed at 11716, down 261 points or 2.18%.
Economic data in coming week:
1. Tuesday 21 February 2023 US reports Flash Manufacturing and Flash Services PMI. On the same day, US reports Flash Services PMI.
2. Thursday 23 February 2023 US FOMC Minutes and preliminary GDP q-on-q.
3. Friday 24 February 2023 US Core PCE Price Index.
Other news:
● Greatwall Motor bought back shares.
● Baidu completes acquisition of GBI Health, a medical business solutions provider.
● Jidu Auto, a joint-venture of Baidu and Zhejiang Geely announced that their auto robot products will integrate Baidu’s AI product ‘Ernie Bot’.
● According to research by China Payment and Clearing Association, WeChat Pay is market leader of offline mobile payment followed by Alipay.
Technical observations
Galaxy Entertainment 27.hk fails back below 2022 high, could retry previous support.
Note chart features:
1. There are two key elements to note in Galaxy’s chart. Firstly, price action shows a very long consolidation rectangle stretching over five quarters starting from around mid-September 2021. Price has broken above this range and will likely form a higher high and higher low. Secondly, moving averages confirm the consolidation period in which the indicators are flat and now they (the averages) are in ascending mode. These two elements tell us we will likely see higher highs (already done, see swing high 3 weeks ago) and higher lows (to look out for).
2. The previous range had a high of around $48.6 based on the highest week close over its duration and low of $40. Recent new swing high was $54.80 again based on the highest week close. This swing high is likely here to stay for the short future as price action looks resisted. $54.35 is one resistance level to look at. This is the highest traded price or 52-week high of 2022. $52.90 is the next resistance drawn from two sets of swing highs. Until $52.90-54.35 is broken, price could retrace further.
3. Since $48.65 is a very prominent previous resistance, look for Galaxy to test this level. Rising 100 and 150 Day SMAs (red and yellow) could also provide support.
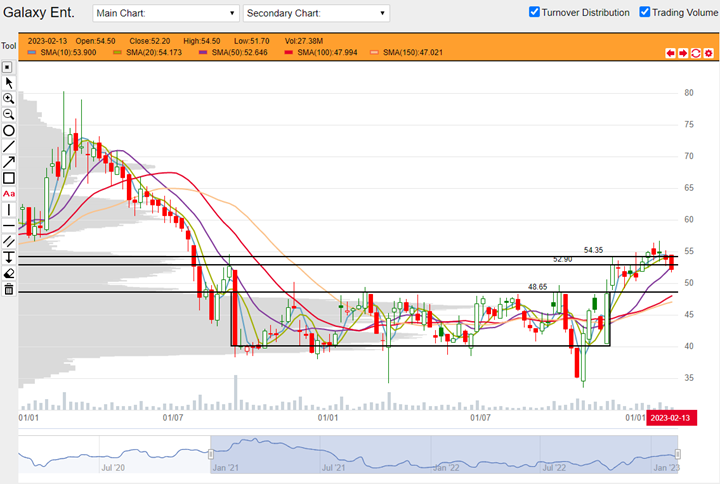
Galaxy Entertainment 27.hk weekly chart from 04 January 2021 to 17 February 2023 (Source: DLC.socgen.com)
Geely Auto 175.hk two dominating features coming to an apex.
Note chart features:
1. There are two very prominent features in this Geely chart. First feature is a set of trendlines that define Geely downtrend from January 2021 till date. These lines connect five prominent swing tops. Second feature is a set of horizontal lines between $10.26-10.60. These lines also connect at least four sets of swing highs and lows. They go back all the way to January 2019 which is outside this chart.
2. Both features are prominent because they are both well verified by price action and span a significant period of time. They represent opposites: trendlines represent resistance and horizontal lines represent support. As price comes to the apex, it seems that one of these features must fail.
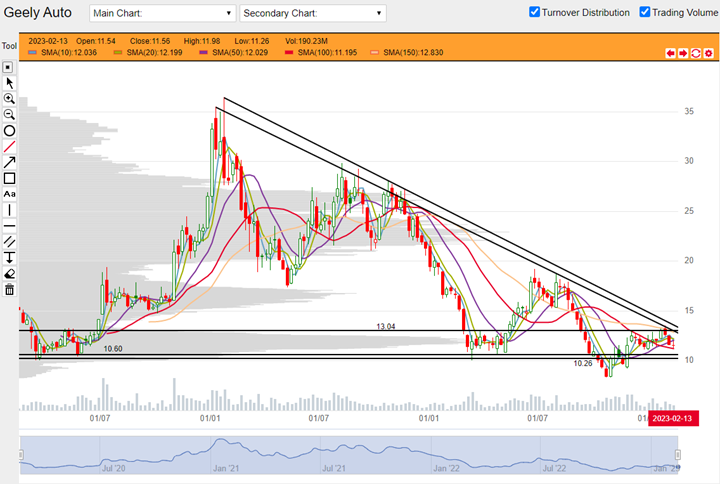
Geely Auto 175.hk weekly chart from 17 February 2020 to 17 February 2023 (Source: DLC.socgen.com)
Underlying Index/Stock |
Underlying Chg (%)1 |
Long DLC (Bid Change%2) |
Short DLC (Bid Change%2) |
|---|---|---|---|
| Hang Seng Index (HSI) | -1.87% | CVMW (-7.71%) | WIEW (+11.72%) |
| Hang Seng TECH Index (HSTECH) | -3.26% | UMCW (-20.83%) | YVRW (+18.00%) |
| Galaxy Ent. (0027.HK) | -0.31% | YKVW (0.00%) | |
| Geely Auto (0175.HK) | -1.58% | DRRW (-8.30%) | MMWW (+11.79%) |
Brought to you by SG DLC Team
This advertisement has not been reviewed by the Monetary Authority of Singapore. This advertisement is distributed by Société Générale, Singapore Branch. This advertisement does not form part of any offer or invitation to buy or sell any daily leverage certificates (the “DLCs”), and nothing herein should be considered as financial advice or recommendation. The price may rise and fall in value rapidly and holders may lose all of their investment. Any past performance is not indicative of future performance. Investments in DLCs carry significant risks, please see dlc.socgen.com for further information and relevant risks. The DLCs are for specified investment products (SIP) qualified investors only.
Full Disclaimer - here