Daily Leverage Certificates
DLC Hotline: (65) 6226 2828
Dollar Index is down year-to-date, DJIA is up, DAX is up and FTSE 100 is up so we are seeing markets at ‘risk-on’ mode when the FOMC, BOE and ECB are announcing their monetary policy next week.
● China’s electricity consumption is predicted to rise 6% in 2023; World Bank forecast China will grow by 4.3%
● Key numbers from Vice Premier Liu He: high tech manufacturing in 2022 up 7.4%, equipment manufacturing up 5.6%.
● China boosts financial opening for foreign firms, approved applications by JP Morgan and Standard Chartered to expand business in Chinese market.
● China Ministry of Culture and Tourism pilots scheme to resume travel groups to selected countries from 6 Feb.
● Global phone shipments declined 18.3% in 4Q 2022, full year numbers fell 11.3% according to International Data Corporation.
● China exported 3.11 million automobiles in 2022, surpassing Germany as world’s second largest auto exporter according to China Automobile Association.
● FTSE 100 Index makes new 52-week high, tops at 7875.58.
● Hong Kong stocks shine. Hang Seng Tech is up 17.93% year-to-date, HSI up 14.70% over the same period.
Hang Seng Index closed this week at 22689, up 644 points or 2.92%. In another 821 points, it would reach 2022’s opening level of 23510 and erase all of last year’s loss. HSI is trading above its entire basket of moving averages so this setup is associated with an uptrend. Since bottoming around 15000 late October last year, HSI has moved up with little pause so short term players could be looking for a take profit level. Investors who have missed the boat could also hope for some retracement or consolidation in order to enter on a surer footing. Based on previous swing highs, 22200 could be a potential resistance while swing lows indicate 23200 could be another. If the index overcomes this zone, 25000 could be another potential resistance based on previous swing high and round numbers.
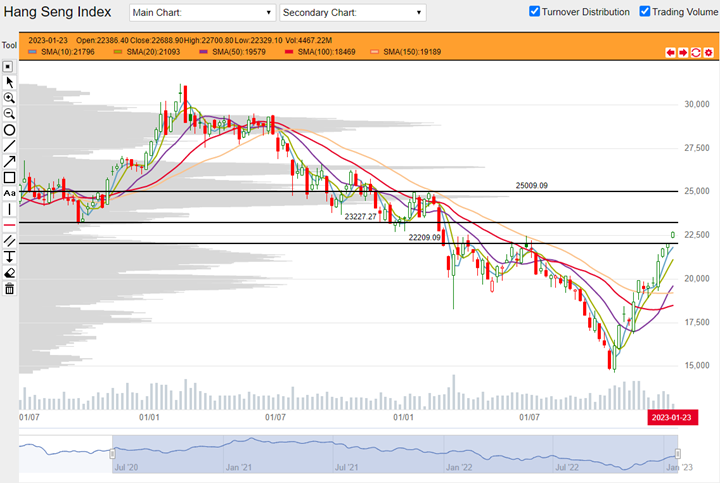
HSI weekly chart from 06 July 2020 to 27 January 2023 (Source: DLC.socgen.com)
Hang Seng Tech closed the week at 4813, up 244 points or 5.35%. HSTech appears to be on its way to 5000 which is both a round number and based on a previous swing high. 5000 could be a potential resistance. After 5000, next level is 6000. As can be seen from the chart, HSTech took around four weeks to build a base at 4000 before advancing. Should there be a retracement, HSTech could come back to this level or stop at around 4500. 4500 appears to have some relevance based on price action over the last two weeks. HSTech is trading above its entire basket of moving averages. This setup is associated with uptrend.

HSTech weekly chart from 05 July 2021 to 27 January 2021 (Source: DLC.socgen.com)
Dow Jones Industrial Average closed the week at 33978, up 603 points or 1.81%. Nasdaq closed the week at 12167, up 548 points or 4.71%. The Dow is presenting two faces. On one hand, it is riding on top of rising moving averages but on the other, it is trading at the high side of Q3 and Q4 2002 and likely to be resisted by Q3-high. With FOMC round the corner, market participants could be evaluating upside and downside propositions closely. Despite stronger performance YTD from the Nasdaq, its chart over a three-year duration appears to be more bearish. Nasdaq is still trading below 2021 low (new 52-week low in 2022) and its 100 and 150 Day SMA are still trending down. This is a setup associated with further losses.
With four more trading days to go till the first FOMC meeting this year, Fed Fund Futures are trading at 98.4% probability of a 25 basis points rate hike. This is followed by a 84.2% probability of another 25 basis points hike to be announced on the 22 March 2023 meeting. The market speculates that rates will reach as high as 5.5% in 2023 and high probability that a rate cut could happen in November.
Shanghai and Shenzhen did not trade this week.
Economic data in coming week:
1. Tuesday 31 January 2023 China reports PMI.
2. Tuesday 31 January 2023 US reports Conference Board Consumer Confidence.
3. Wednesday 01 February 2023 China reports HSBC PMI.
4. Wednesday 01 February 2023 Germany reports CPI flash estimate.
5. Wednesday 01 February 2023 US reports ADP Non-Farm Employment Change, ISM Manufacturing PMI and JOLTS Job Openings.
6. Thursday 02 February 2023 FOMC Statement and Press Conference.
7. Thursday 02 February 2023 BOE Monetary Policy Report followed by ECB Monetary Policy Statement, Press Conference.
8. Friday 03 February 2023, US Non-Farm Payrolls and ISM Services PMI.
Other news:
● AIA bought back shares.
● China Life Insurance, China Mobile, CNOOC, Galaxy Entertainment, Petrochina, Sands China and SHK Properties made new 52-week highs.
● According to Travel Industry Council of Hong Kong, mainland tour groups will visit Hong Kong starting 06 February 2023. Over 10 groups per day are expected.
● CK Asset wins tender for New Kowloon lot.
● Activist investor Ryan Cohen has reportedly built a large stake in Alibaba and is pushing for aggressive stock buybacks.
● China Securities Regulatory Commission has approved Standard Chartered to set up a wholly-owned securities business to provide services such as brokerage and underwriting.
Technical observations
HKEX 388.hk uptrend but price action tentative.
Note chart features:
1. Hong Kong Exchange is currently on an upswing. It is also trading above all of its moving averages so this is a setup that is associated with further gains. The current upswing (see rightmost upward diagonal line) appears more extended than previous ones but there is precedent for even more (see period September 2020 to February 2021 or first set of high-low points of the downward parallel channel).
2. There is a potential resistance around $381 based on at least three previous swing highs. This level has some relevance as price action over the past 3 weeks formed Dojis although price has not hit $380 yet. There could be another try since 10 and 20 Day SMA are still rising.
3. Investors who have not hopped on board could look for a consolidation in order to enter on a surer footing. Previously there was a minor consolidation in December 2022 and this formed a potential support at around $345. A deeper retracement or throwback if any could see the stock trade back to $320-330 region where 100 and 150 Day SMAs meet.
4. Based on a golden cross in the longer 100 and 150 Day SMAs in the beginning of this month, HKEX downtrend that started in Q4 2021 could be over. However uptrends do not always follow downtrends as price could move to a sideways range.

HKEX 388.hk weekly chart from 06 July 2020 to 23 January 2023 (Source: DLC.socgen.com)
Alibaba 9988.hk rising, could be near potential resistance.
Note chart features:
1. Based on moving averages, a golden cross between 100 and 150 Day SMA early this month could mean that Alibaba’s downtrend that started in Q1 2021 is over. At the moment, Alibaba is trading above its entire basket of averages. This is a setup associated with further gains.
2. Based on the extent of previous upswings in the past two years (see black diagonal lines), Alibaba could be at the end of the current swing although there is always the possibility of an unprecedented move. Previous swing highs indicate potential resistance from $110 - 121 so Alibaba could be already inside such a resistance zone. Price action over the past two weeks show that the length of each weekly candle is becoming shorter so the market could be giving a nod to this resistance. If $121 is indeed a potential level, then price could have a little more room overhead.
3. Although downtrend could be over, price could switch to a sideways range instead. Since stock price moves in zigzag fashion, there could also be a throwback or deeper retracement in the near future. A throwback to $65-70 region could be a good test of 100 and 150 Day SMA as support and would give the bottom an inverted head and shoulders symmetry that is better associated with reversals.
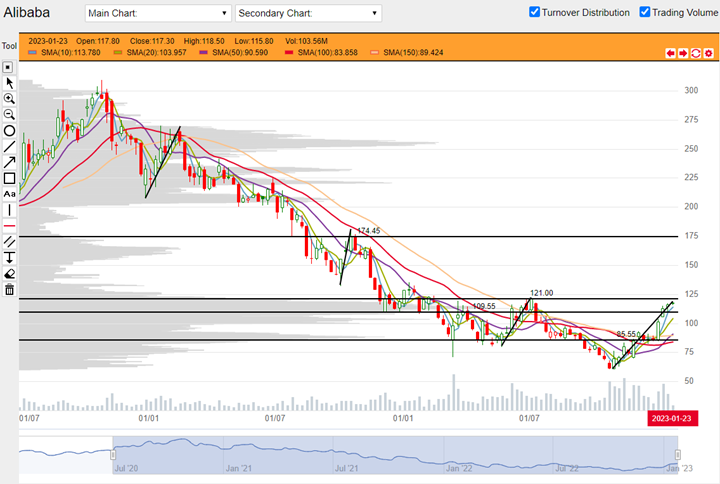
Alibaba 9988.hk weekly chart from 06 July 2020 to 23 January 2023 (Source: DLC.socgen.com)
Underlying Index/Stock |
Underlying Chg (%)1 |
Long DLC (Bid Change%2) |
Short DLC (Bid Change%2) |
|---|---|---|---|
| Hang Seng Index (HSI) | -1.87% | CVMW (-7.71%) | WIEW (+11.72%) |
| Hang Seng TECH Index (HSTECH) | -3.26% | UMCW (-20.83%) | YVRW (+18.00%) |
| HKEX (0388.HK) | -2.70% | ENTW (-12.39%) | |
| Alibaba (9988.HK) | -3.89% | 9O5W (-18.43%) | Z7MW (+21.01%) |
Brought to you by SG DLC Team
This advertisement has not been reviewed by the Monetary Authority of Singapore. This advertisement is distributed by Société Générale, Singapore Branch. This advertisement does not form part of any offer or invitation to buy or sell any daily leverage certificates (the “DLCs”), and nothing herein should be considered as financial advice or recommendation. The price may rise and fall in value rapidly and holders may lose all of their investment. Any past performance is not indicative of future performance. Investments in DLCs carry significant risks, please see dlc.socgen.com for further information and relevant risks. The DLCs are for specified investment products (SIP) qualified investors only.
Full Disclaimer - here