Market Commentary - For the week ending 25 November 2022
Risk on mode continues as FOMC meeting minutes are seen as dovish. Eyes on Natural Gas and Crude Oil as winter starts. The EU Parliament could not come to consensus on price cap level for Russian crude.
● China and Japan holdings of US Treasuries cut significantly in September 2022.
● PBOC announces 25 basis points to reserve requirement ratio (RRR) for financial institutions from 05 Dec 2022.
● China looking at ‘rural revitalisation’.
● Indonesia proposes an ‘Opec-like’ Nickel cartel.
● Qatar 2022 FIFA World Cup a boon to Chinese home appliance exports.
● Beijing locks down after Covid surge.
● DXY weekly chart suggests support at Q2 2022 high.
Hang Seng Index closed this week at 17574, down 412 points or 2.29%. It was a slow week with few drivers captured visually as a short end-of-week Doji. As can be seen from the weekly chart below, last week’s Doji was a nod to resistance at 18000 as a significant round number as well as swing low from March this year. Early bulls likely took profit while spectators waited on sidelines for bargains. Potential support levels could come from 10 or 20 Day SMA around 16800-16900. Next support after could be 16000. Long term indicators are still pointing down. This setup is still associated with further losses. No conventional reversal pattern can be observed so far.
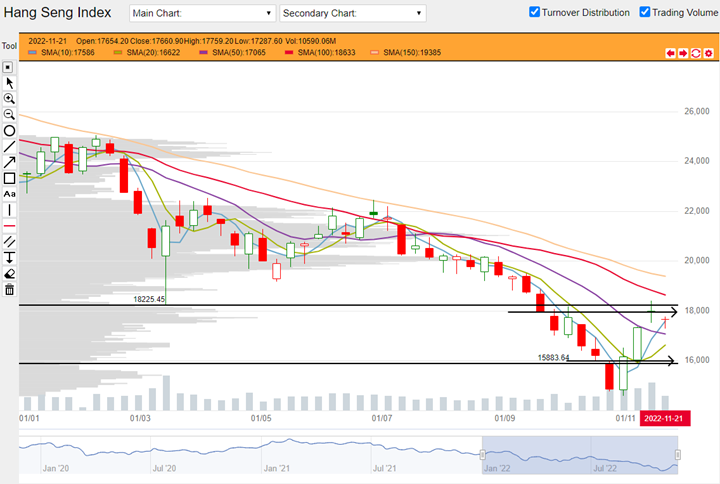
HSI weekly chart from 03 January 2022 to 25 November 2022 (Source: DLC.socgen.com)
Hang Seng Tech closed the week at 3500, down 240 points or 6.42% over last week. HSTech could find support at 3350 – 3500 in a confluence of round number, previous low and rising short term moving averages. If support could be found here, then the next major resistance is 4000, which is also confluent with 100 and 150 Day SMA. Long term moving averages are falling so this setup is associated with further losses. On the other hand, if HSTech stays above March low, it is a bullish divergence from HSI and could be a sign of deeper strength than the main index.
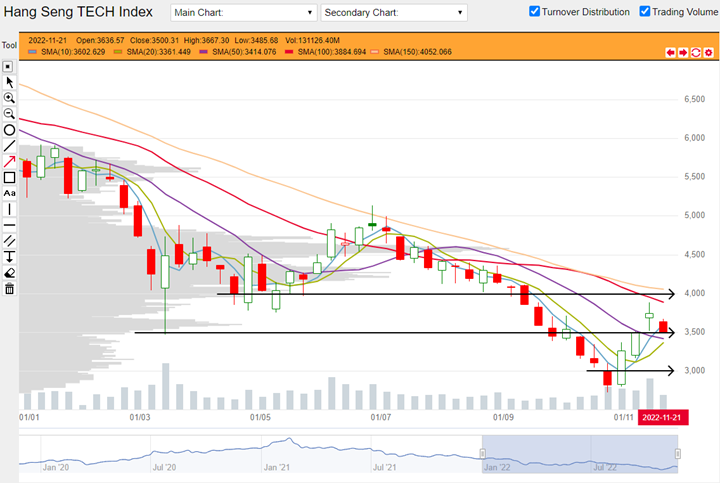
HSTech weekly chart from 03 January 2022 to 25 November 2022 (Source: DLC.socgen.com)
Dow Jones Industrial Average creeps upwards to close at 34347, up 601 points or 1.78%. Nasdaq closes at 11756, up 79 points or 0.68%. Nasdaq continues to diverge bearishly from the Dow. The Dow is now slightly above Q3 high but this could still be a potential turning point. Long term moving averages converge at the 31000 – 32000 level so this could be a potential support. No conventional reversal pattern can be observed and long term moving averages are still in a setup associated with downtrend.
Fed funds futures on rate hike probability by next Fed meeting on 14 December as at last DLC commentary on 18 Nov:
● 75.8% probability of 50 basis points rate hike | 24.2% probability of 75 basis point hike
Fed funds futures on rate hike probability by next Fed meeting on 14 December at this week’s reading:
● 75.8% probability of 50 basis points rate hike | 24.2% probability of 75 basis point hike
Note: Fed fund futures on rate hike probability did not change between last week and this. This also backs up the lack-of-vigor performance from both the Dow and Nasdaq (as well as HSI).
Market foresees the Fed to end December 2023 at rates between 3.75% and 5.75%. Highest probability expectation is end rate of 4.5-4.75% rate at 29.5% probability.
Shanghai Composite closed this week at 3102, up 5 points or 0.14% from last week. Shenzhen Index closed the week at 10904, down 276 points or 2.47%. Shanghai Composite is trading between its long and short term moving averages meaning there are equal prospects for bullish and bearish moves. Shenzhen Index has however closed back below all its moving average indicators. This does not mean that Shenzhen is entirely bearish. There is still potential support from 10800 based on swing lows in Q2 and Q3. Nearly symmetrical swing lows in early-May and then late-October suggests that a potential double bottom chart pattern should also be considered.
Economic data in coming week:
1. US reports CB Consumer Confidence on Tuesday 29 November 2022.
2. US reports ADP Non-Farm Employment Change, GDP q-on-q and JOLTS Job Openings on Wednesday 30 November 2022.
3. Fed Chair Powell to speak on Thursday 01 December 2022.
4. US reports Core PCE Price Index and ISM Manufacturing PMI on Thursday 01 December 2022.
5. US reports Non-Farm Payrolls on Friday 02 December 2022.
Other news:
● AIA, Greatwall Motor, Sinopec and Tencent buy back shares.
● Cosco Shipping makes new 52-week low.
● Sinopec signs a 27-year LNG deal with QatarEnergy.
● Chinese express logistics giants are making big moves in ASEAN under the RCEP framework.
● Berkshire Hathaway cuts BYD stake again.
● China’s property developers secure loans with banks after a 16-point guide published.
● Ganfeng Lithium proposes spinoff and listing of Ganfeng LiEnergy on SZSE.
● Hong Kong’s new international carbon marketplace launched on HKEX see’s significant volume in voluntary carbon trading.
Technical observations
Kuaishou Technology 1024.hk rises on high volume, year-long consolidation, a feature to follow closely.
Note chart features:
1. Kuaishou rose in high volume over the past 4 weeks. At the moment it is supported by its bullish short term 10 and 20 Day SMA rising from below.
2. Potential resistance could come in around $58-68. This region was drawn from previous swing lows going back till August 2021. In addition, 100 and 150 Day SMA (red and yellow) can be found here.
3. Kuaishou printed a very long horizontal range extending from August 2021 until September this year. Its year-long duration makes support and resistance levels associated with this pattern very obvious and therefore significant. If the stock can successfully move back into this range, then price action within the range could replay according to associated levels. It could also be a base for higher moves.
4. If Kuaishou cannot overcome the $58-68 resistance, it could continue its current descent.
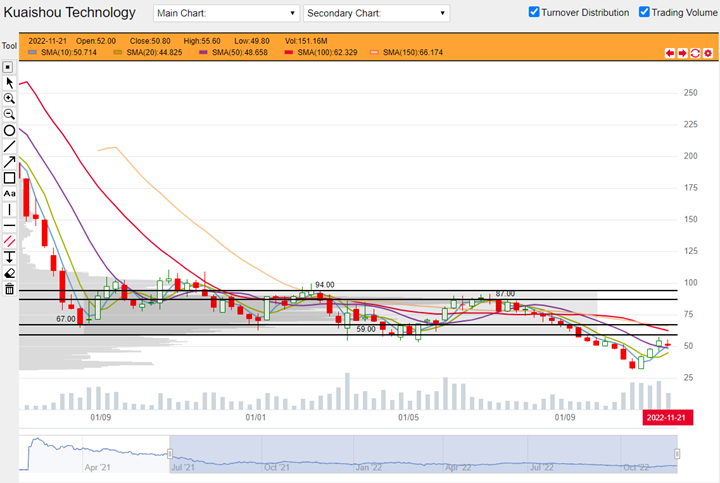
Kuaishou Technology 1024.hk weekly chart from 05 July 2021 to 25 November 2022 (Source: DLC.socgen.com)
Sunny Optical 2382.hk 3-year resistance overhead, moving average indicators converge.
Note chart features:
1. Sunny Optical ran into a 3-year low turned resistance last week. A level of this duration is significant. In addition, there was confluence with 100 and 150 Day SMA (red and yellow) as well as a round number $100 right at the same region. Price action last week and this acknowledge the presence of said region.
2. Price structure with its series of lower lows and long term moving averages are associated with further losses. No reversal price pattern is observable so far. Volume over the past four weeks when price is gaining is high but not significant.
3. If price could recover above the $100 region, then this could be a significant level to build base for higher move. If not, then $67 -100 could be its new boundaries. In the meantime, prices could find potential support from 10 and 20 Day SMA which are rising.
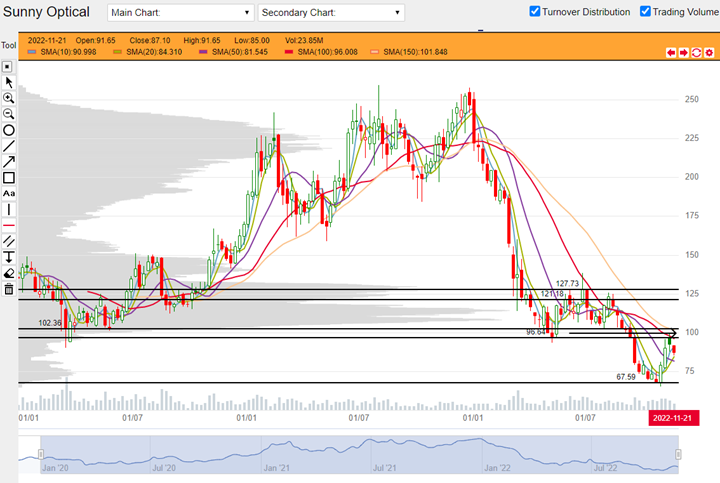
Sunny Optical 2382.hk weekly chart from 06 January 2020 to 25 November 2022 (Source: DLC.socgen.com)
Brought to you by SG DLC Team
This advertisement has not been reviewed by the Monetary Authority of Singapore. This advertisement is distributed by Société Générale, Singapore Branch. This advertisement does not form part of any offer or invitation to buy or sell any daily leverage certificates (the “DLCs”), and nothing herein should be considered as financial advice or recommendation. The price may rise and fall in value rapidly and holders may lose all of their investment. Any past performance is not indicative of future performance. Investments in DLCs carry significant risks, please see dlc.socgen.com for further information and relevant risks. The DLCs are for specified investment products (SIP) qualified investors only.
Full Disclaimer - here