Market Commentary - For the week ending 18 November 2022
Dollar Index DXY formed a Doji on the weekly chart following last week’s 4.4% correction, showing its indecision. HKD strengthens further against USD, flow favorable to HK Stocks.
● FOMC members Waller, Bullard et al, speaking from Sunday 13 November to Thursday 17 November pushed the impression of a hawkish Fed.
● China announced its real estate rescue package detailed in a 16-point guide addressed to finance officials.
● Major Wall Street banks may lay off 10% of Chinese investment bankers in 2023.
● Yellen meets PBOC Yi Gang on the side of G20.
● Household energy bills and food prices push UK inflation to 41-year high; Hunt hikes taxes, tightens spending.
● BOJ Kuroda insists on ultra-loose monetary policy despite 40-year high inflation.
● The Ministry of Commerce announces China FDI Jan-Oct 2022 increased 17.4% led by South Korea and Germany.
Hang Seng Index closed this week at 17986, up 660 points or 3.81% from last week. This week’s Doji candle is probably a nod to possible resistance at round number of 18000 as well as March swing low at 18235.50. Should this set of numbers be overcome, the next potential milestone is 20000. Note that based on Turnover Distribution (see gray horizontal histogram at left), there is a major peak here which means that a lot of volume changed hands at around 20000. The significance of such a volume changing hands means that there is likely to be a lot of vested interests/emotion at this level. Turnover Distribution at 18000 shows only a minor peak. Long term moving averages still indicate downtrend although 10 and 20 Day SMA are bullish and could provide support for further gains.
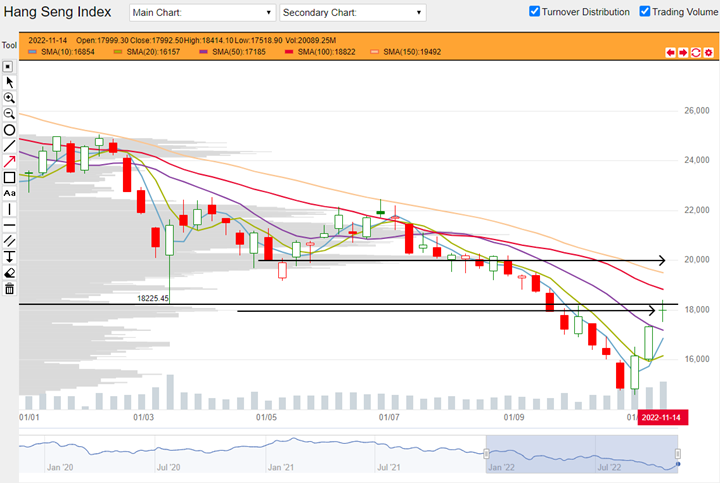
HSI weekly chart from 03 January 2022 to 18 November 2022 (Source: DLC.socgen.com)
Hang Seng Tech Index closed the week at 3740, up 249 points or 7.12% over last week. HSTech is now parked between 3500 and 4000. 3500 could provide support with confluence from 50 Day SMA (purple) as well as March swing low at 3463. 4000 offer potential resistance with confluence from May-swing low as well as 100 and 150 Day SMA (red and yellow). Long term moving averages still indicate downtrend but 10 and 20 Day SMA are bullish.
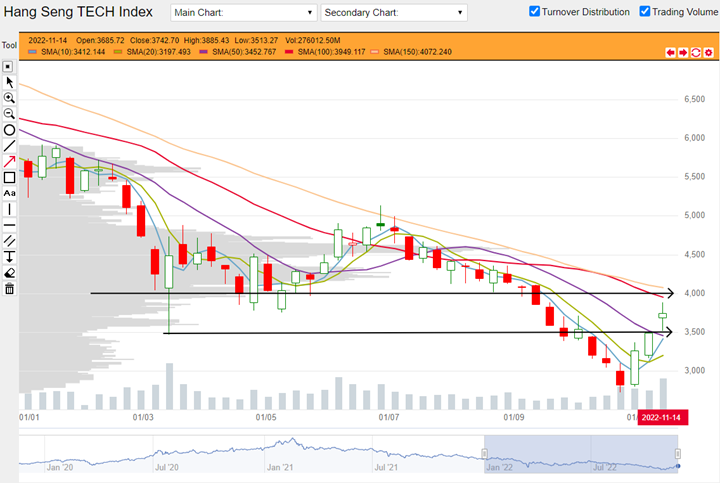
HSTech weekly chart from 03 January 2022 to 18 November 2022 (Source: DLC.socgen.com)
Dow Jones Industrial Average closed at 33746, down 2 points or 0.01% from last week. Nasdaq closed at 11677, is up by a hair with 0.16 points. On the weekly chart, DJIA closed nearly as the swing high in Q3. In contrast, Nasdaq is the very picture of weakness with a glaring bearish divergence. Based on moving averages, Nasdaq’s setup is clearly a bear rally and poised for further losses. Over a one month period, DJIA’s biggest loser is Disney (-9%). Big losers in the Nasdaq over the same duration are Amazon (-18%), Tesla (-18%) and Meta (-16%)
Fed funds futures on rate hike probability by next Fed meeting on 14 December as at last DLC commentary on 11 Nov:
● 83% probability of 50 basis points rate hike | 17% probability of 75 basis point hike
Fed funds futures on rate hike probability by next Fed meeting on 14 December at this week’s reading:
● 75.8% probability of 50 basis points rate hike | 24.2% probability of 75 basis point hike
Market foresees the Fed to end December 2023 at rates between 3.75% and 5.75%. Highest probability expectation is an end rate of 4.5-4.75% rate at 29.1% probability.
Shanghai Composite closed this week at 3097, up 10 points or 0.32% from last week. Shenzhen Index closed the week at 11180, up 41 points or 0.36%. Both indices are trading between long and short term moving averages. This means there are equal prospects for consolidation leading to bullish reversal as well as distribution and resuming downtrend action. Nearly symmetrical swing lows in early-May and then late-October suggests that a potential double bottom chart pattern should also be considered. For both indices, long term moving averages indicate downtrend but short term 10, 20 and 50 Day SMA are bullish and provide potential support.
Economic data in coming week:
1. A host of Fed members, central bankers will speak next week.
2. France, Germany, UK and US will report manufacturing and services PMI on Wednesday 23 Nov 2022.
3. Fed to release November FOMC meeting minutes on Wednesday 23 Nov 2022.
Other news:
● AIA, Greatwall Motor and Sinopec buy back shares.
● CSPC Pharmaceutical and SHK Properties print new high for 2022.
● BYD terminated BYD Semicon’s spin-off and listing on SZSE.
● AAC Tech subsidiaries involved in patent infringement with Sunny Optical.
● BYD celebrates 3-millionth NEV to roll off assembly line.
● Tencent distributes Meituan shares in a special interim dividend.
● Baba rolls out a new e-commerce platform in Spain.
● China Mobile joins Hebei Provincial Government to construct digital infrastructure.
● Kuaishou and singer Jay Chou join hands to organize an online concert; reservations already exceed 25 million.
● Changes will be made to the 50-constituent HSCEI index on 05 December 2022 as part of periodic review. PetroChina to be added. Ali Health and Bilibili will be removed.
Technical observations
Tencent 700.hk volume suggests gains could continue, potential resistances congest above $330.
Note chart features:
1. Price movement from $200 to $300 in three weeks was smooth but this week’s overhead tail in the candlestick is likely a nod to potential resistance at $300. This level can be drawn from swing lows in March and August this year. Price gains could continue as volume expanded this week.
2. A minor potential resistance could be encountered at around $330. This is drawn from swing low in the last week of August. Proceeding above $330, it becomes difficult to identify a discrete level. More likely resistance could be found in a zone from $360 -380. Inspecting Turnover Distribution (see gray horizontal histogram at left), a major peak coincides with this zone.
3. Long term moving averages are still spaced widely and pointing down. This setup is associated with downtrend and further losses. There is also no evidence of a reversal chart pattern. Short term averages 10 and 20 Day SMA are however bullish and could provide base for further gains.
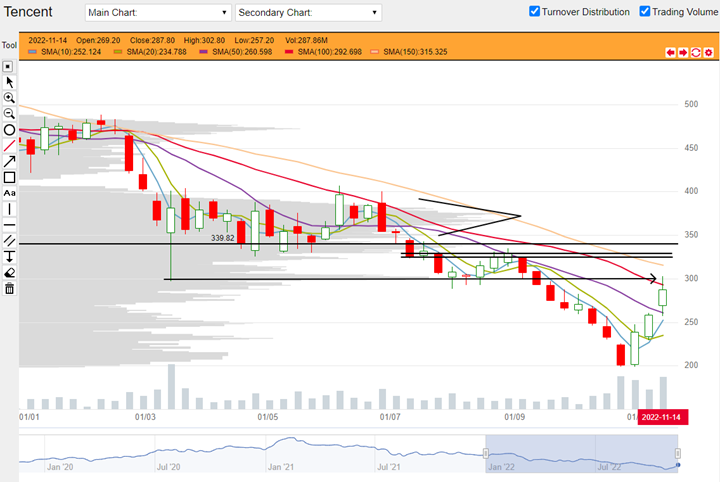
Tencent 700.hk weekly chart from 03 January 2022 to 18 November 2022 (Source: DLC.socgen.com)
Alibaba 9988.hk volume suggests gains could continue, long term moving averages are converging.
Note chart features:
1. This week’s price action is bullish and expanding volume suggests that the current expansion could continue. This week’s long overhead tail in the candlestick is however a nod to possible overhead resistance between $80-82. This zone can be drawn from previous swing lows between April to May this year as well as a one-week uptick in early October.
2. Above $82, other potential resistance could be a zone between $94-96 and then $118-122. $100 could also be a potential resistance since it is a round number-milestone.
3. Long term moving averages still indicate downtrend. There is no noticeable reversal chart pattern yet. However the 100 and 150 Day SMA (red and yellow) appear to be converging. This usually happens when a trend slows down or price moves sideways. It could be a signal that price is headed for a sideway range or consolidation. 10 and 20 Day SMA are bullish and could provide support for further gains
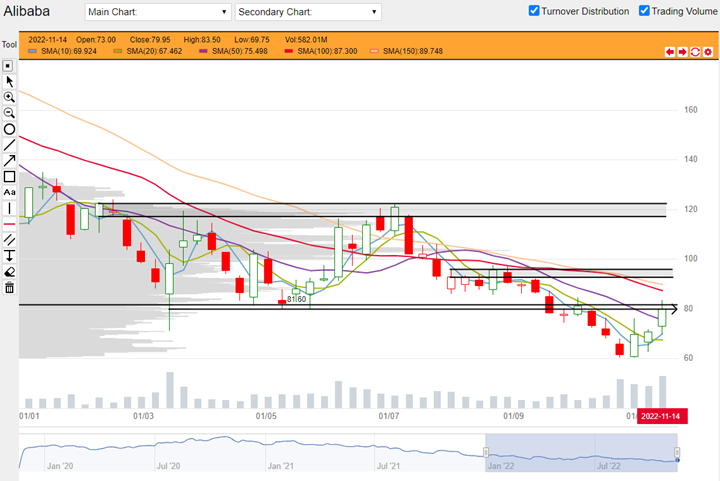
Alibaba 9988.hk weekly chart from 03 January 2022 to 18 November 2022 (Source: DLC.socgen.com)
Brought to you by SG DLC Team
This advertisement has not been reviewed by the Monetary Authority of Singapore. This advertisement is distributed by Société Générale, Singapore Branch. This advertisement does not form part of any offer or invitation to buy or sell any daily leverage certificates (the “DLCs”), and nothing herein should be considered as financial advice or recommendation. The price may rise and fall in value rapidly and holders may lose all of their investment. Any past performance is not indicative of future performance. Investments in DLCs carry significant risks, please see dlc.socgen.com for further information and relevant risks. The DLCs are for specified investment products (SIP) qualified investors only.
Full Disclaimer - here