Daily Leverage Certificates
DLC Hotline: (65) 6226 2828
‘Cool’ CPI print triggers risk-on mode for Forex, US stocks. USDHKD flows in favor of the Hong Kong Dollar boosts the Hang Seng Index as HK market follows through last week’s bullish engulfing candle. WTI Crude Oil is likely supported at previous 52-week high, a setup associated with further gains.
● US Core CPI for October comes in at 7.7%, misses expectation (7.9%) and is lower than September print (8.2%).
● UK PM Sunak and Chancellor Hunt plan ‘stealth’ tax on pensions.
● China ups financing for the private sector.
● MNCs inked $73.5Billion worth of deals at China International Import Expo, up 3.9% y-on-y.
● China eases inbound quarantine measures to ‘5+3’, one nucleic acid testing instead of two.
● US customs reportedly seized over 1000 shipments of solar energy components from Chinese companies.
Hang Seng Index closed this week at 17326, up 1165 points or 7.21%. Price action is a clear followthrough of last week’s bullish engulfing candle. HSI beat the 10 and 20 Day SMA so it is possible for these two to become support to carry the index higher in the next few weeks. Longer term moving averages are still moving down. Additionally the index is also below its previous 52-week low at 22665 printed in December 2021. These features are associated with further losses. Overhead, any turning point, round number such as 18000, or any other moving average could be an excuse for participants to square their positions. 20000 is more significant because of the swing lows in March and May this year as well as the number of weekly candles sticking to this zone in August.
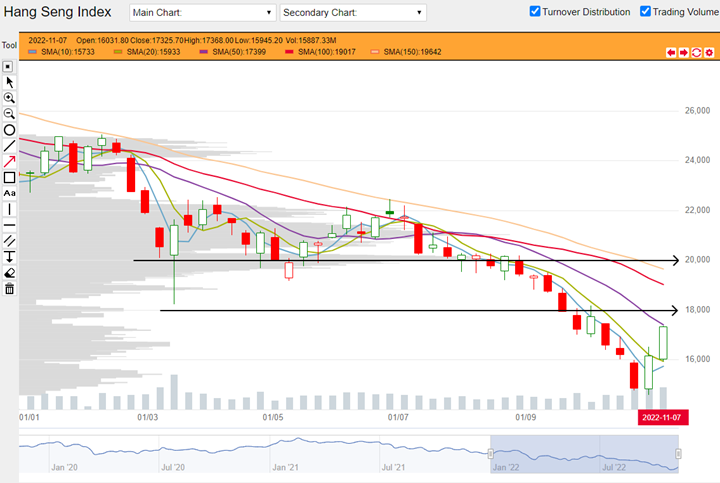
HSI weekly chart from 03 January 2022 to 11November 2022 (Source: DLC.socgen.com)
Hang Seng Tech Index closed the week at 3492, up 227 points or 6.97%. HSTech price action is also a followthrough from last week’s bullish engulfing pattern. Notably we see 10 and 20 Day SMA form a support below so these could carry the index higher in the coming weeks. Overall, HSTech is still trading below its long term moving averages as well as its previous 52-week low at 5428 printed in December 2021. These features are associated with further losses. 3500 could be a potential resistance because of swing low in March this year as well as 50 Day SMA (purple) nearby. 4000 could be a more prominent resistance however because it was tested by multiple weeks between April and May as well as 100 Day and 150 Day SMA (red and yellow) nearby.
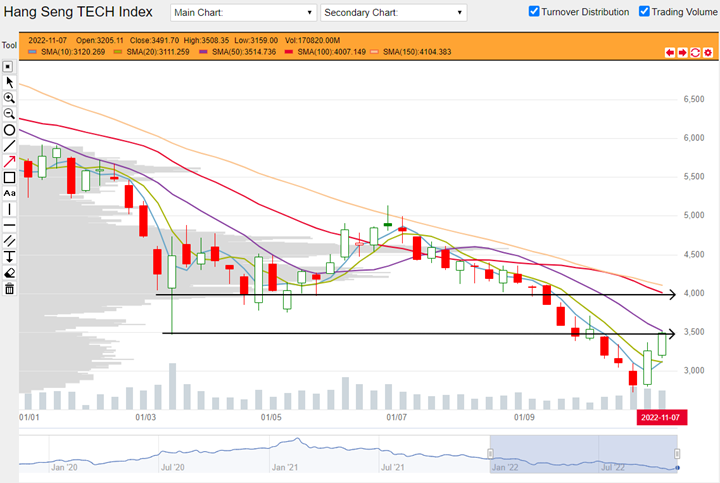
HSTech weekly chart from 03 January 2022 to 11November 2022 (Source: DLC.socgen.com)
Dow Jones Industrial Average closed at 33748, up 1345 points or 4.15%. Nasdaq closed at 11817, up 960 points or 8.84%. DJIA is the stronger of the two as it has moved above its entire complex of moving averages. For both indices however, long term averages are still in downtrend mode. In addition Nasdaq is still trading below its previous 52-week low that signals further losses. It is likely this week’s bullishness is linked to a weaker than expected CPI driving risk-on mode in multiple assets. Headlines suggest the market is looking at a slowdown in Fed hikes but a slowdown is neither a halt nor a U-turn.
Fed funds futures on rate hike probability by next Fed meeting on 14 December as at last DLC commentary on 04 Nov:
● 52.0% probability of 50 basis points rate hike | 48.0% probability of 75 basis point hike
Fed funds futures on rate hike probability by next Fed meeting on 14 December at this week’s reading:
● 83% probability of 50 basis points rate hike | 17% probability of 75 basis point hike
This is a big shift in hike expectations away from 75 basis points. At the last reading, rate expectations for end December 2023 is 5.75% and a miniscule 0.01% chance of easing at the same meeting. This week’s readings reflect a wide divergence in expectations. The market now sees the Fed ending December 2023 with rates ranging from 3.5 – 5.75%. However most expect (mode and median) the Fed to peg rates at 4.5-4.75% 13 months from now (paraphrase: most expect only another 75 basis points hike in the whole of next 13 months).
Shanghai Composite closed this week at 3088, up 16 points or 0.54%. The Shenzhen Index closed the week at 11140, down 48 points or 0.43%. Although both indices printed bullish engulfing candlestick patterns last week, their movements this week were muted because of their 50 Day SMA which were very close by. There could be some whipsaw in the near future with 10 and 20 Day SMA as support and longer moving averages as resistance. Long term moving averages for both indices are still moving down so their setup is still associated with further losses.
Economic data in coming week:
1. China to report retail sales on Tuesday 15 November 2022.
2. US to report PPI and Empire State Manufacturing Index on Tuesday 15 November 2022.
3. UK to report CPI on Wednesday 16 November 2022.
4. US to report retail sales on Wednesday 16 November 2022.
5. UK to report Monetary Policy Report Hearings on Wednesday 16 November 2022.
6. US to report Philadelphia Fed Manufacturing Index on Thursday 17 November 2022.
Other news:
● AIA, CK Asset, Greatwall Motor and Sinopec buy back shares.
● Meituan to build a Smart Logistics Hub at Beijing Daxing International Airport.
● China Mobile announces to hike dividend payout ratio this year and next.
● Sinopec Corp announces that controlling shareholder Sinopec Group will transfer its A shares in the company to PetroChina in a gratuitous transfer.
● Berkshire Hathaway offloaded holdings of BYD company for the second time this month.
Technical observations
Li Ning 2331.hk retraces on high volume but setup is still associated with further losses.
Note chart features:
1. Li Ning chart indicates that trading over the past four weeks including this one was accompanied by high volume on the way down and high volume on the way up. High volume accompanied with down sessions is a price action that is associated with further losses. It likely involves a high level of short selling. In this light, price rally over the last two weeks with volumes that mirror the selling weeks suggests that this recent gain was achieved by short covering. In combination with the two swing lows in March and May this year, it is likely that $50 will become support for now.
2. Overhead, Li Ning could run into potential resistance at around $60. This price level was referenced from a swing low late September as well as the presence of the 50 Day SMA nearby (purple). 50 Day SMA was a previous resistance. Confluence of 100 and 150 Day SMA (red and yellow) between $63-64 could also act as resistance.
3. Li Ning’s chart pattern has not changed. Moving averages are still falling and indicate further losses. No prominent bullish reversal pattern can be observed yet.
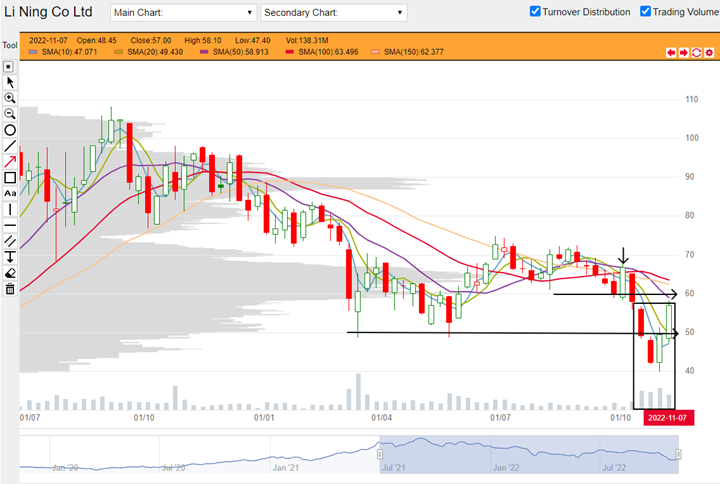
Li Ning 2331.hk weekly chart from 05 July 2021 to 11 November 2022 (Source: DLC.socgen.com)
BYD Electronic 285.hk recovers previous 52-week low; building base here could lead to gains.
Note chart features:
1. $22.10 is the previous 52-week low for BYD Electronic. This level was printed in November 2021. Price trading below previous 52-week lows are associated with further losses. Price trading above this level can build a base leading to further gains. At a time when many stocks are making new lows, BYD Electronic has instead shown bullish divergence to the rest by going sideways (in fact can be described as a higher low when we compare swing lows in May and October this year). This bullish divergence could be a hint of hidden strength that shareholders are reluctant to offload.
2. Moving averages are flatlining. This suggests that price is moving from a downtrend to a sideway mode, perhaps even reversing. For now, these averages are below price so could act as support as well.
3. Overhead, $25 is a potential support. This is drawn from turning points in July and September this year. The fact that price closed around this level for the past two weeks is an acknowledgement from the market.
4. Further higher, note $28.50 is the opening price for this year and $29.40 is the highest traded price for 2022.
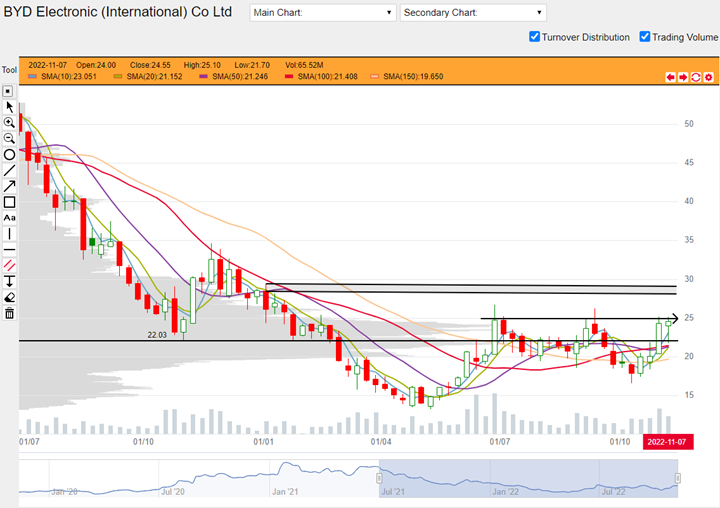
BYD Electronic 285.hk weekly chart from 05 July 2021 to 11 November 2022 (Source: DLC.socgen.com)
Underlying Index/Stock |
Underlying Chg (%)1 |
Long DLC (Bid Change%2) |
Short DLC (Bid Change%2) |
|---|---|---|---|
| Hang Seng Index (HSI) | -1.90% | CVMW (-8.55%) | WIEW (+8.47%) |
| Hang Seng TECH Index (HSTECH) | -1.88% | CWUW (-8.85%) | XNOW (+12.57%) |
| Li Ning Co Ltd (2331.HK) | -3.51% | DJZW (0.00%) | |
| BYD Electronic (International) Co Ltd (0285.HK) | +0.32% | 9IMW (+2.94%) |
Brought to you by SG DLC Team
This advertisement has not been reviewed by the Monetary Authority of Singapore. This advertisement is distributed by Société Générale, Singapore Branch. This advertisement does not form part of any offer or invitation to buy or sell any daily leverage certificates (the “DLCs”), and nothing herein should be considered as financial advice or recommendation. The price may rise and fall in value rapidly and holders may lose all of their investment. Any past performance is not indicative of future performance. Investments in DLCs carry significant risks, please see dlc.socgen.com for further information and relevant risks. The DLCs are for specified investment products (SIP) qualified investors only.
Full Disclaimer - here