Daily Leverage Certificates
DLC Hotline: (65) 6226 2828
Market Commentary (Hong Kong)
For the week ending 28 June 2024
The Nasdaq 100 closed Friday’s end-of-quarter session with a shooting star candle at last week’s high. USDJPY hit a new high of 161.30.
● The EU charged Apple for violating the Digital Markets Act, a new law passed in 2022.
● According to Bloomberg, China’s well-heeled by snapping up Shanghai’s luxury real estate.
● AI startup Etched, received $120 million funding to produce its Sohu chip which is rated at 20 times faster than its Nvidia peer.
● BRICS will pause further enlargement in order to integrate newly joined members; close to 30 countries have expressed their desire to join the bloc.
● Saudi Arabia joins the mBridge platform. mBridge is a joint project of several central banks and the BIS. It is a multi-currency blockchain platform designed for real-time cross border payment.
● New questions arise over Biden’s cognitive abilities after his debate with Trump.
Hang Seng Index closed this week at 17717, down 310 points or 1.72%. This week’s candle closed at a nine-week low as well as below its 10, 20 and 50-Day SMAs. The index could still be part of an uptrend setup as it printed a higher high in May this year compared to a previous swing high in March. A confluence of the 100 and 150-Day SMAs as well as the lower bound of a rising channel at 17000 could be a potential target.
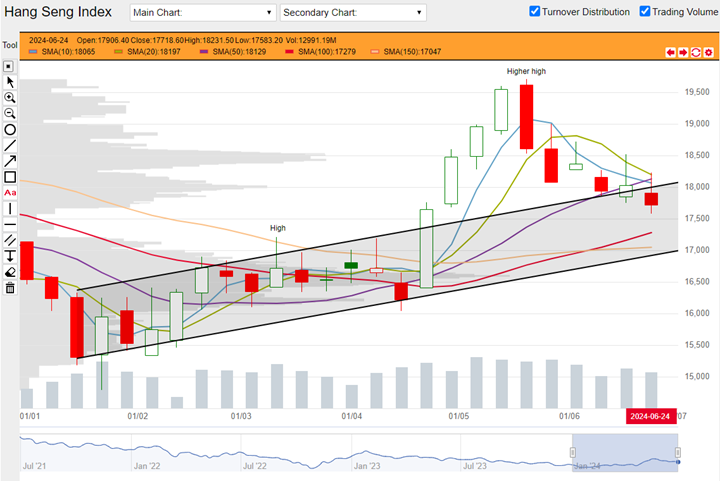
HSI weekly chart from 01 January 2024 to 28 June 2024 (Source: DLC.socgen.com)
Hang Seng Tech closed the week at 3554, down 147 points or 3.97%. It closed at a nine-week low and also below its entire basket of moving averages. This poses a question as a close below all moving averages is usually associated with further losses but HSTech has a higher swing high and a number of golden crosses pointing to a bullish trend. Note that the previous swing high in March this year closed at the highest end-of-week close of 3550 and this week’s ending level stopped just before.
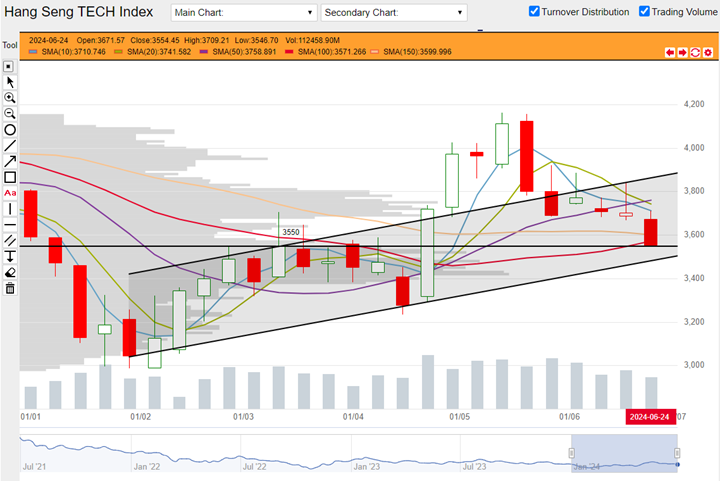
HSTech weekly chart from 01 January 2024 to 28 June 2024 (Source: DLC.socgen.com)
The Dow closed above its basket of moving averages. This is a setup that is usually associated with further gains. The Nasdaq 100 made another new high but on the daily chart, the Friday close is a shooting star. It is possible there could be a potential resistance overhead that is now in place for two weeks.
The next FOMC meeting is scheduled on 31 July 2024.
Fed funds futures on rate hike probability by next Fed meeting as at this week’s close:
● 10.3% probability of 25 basis points cut |89.7% probability of no change
Fed funds futures on rate hike probability by next Fed meeting at last week’s close:
● 10.3% probability of 25 basis points cut |89.7% probability of no change
Probabilities on the CME Fedwatch Tool indicate a 25-basis points cut could start as early as the coming FOMC meeting in July. There is also a possibility for a cumulative 100 basis points cut between now to December this year.
Shanghai and Shenzhen continue to fall. Shanghai is now 6.5% off its year-to-date high in May while Shenzhen is down 9.8%. Both closed below their entire basket of moving average indicators. This is a setup associated with further losses.
Other news:
● AIA, Kuaishou, Meituan, Tencent and Xiaomi bought back shares.
● China Mobile and Petrochina printed new 52-week highs. Baidu, Ganfeng Lithium and Sands China printed new 52-week lows.
● Vehicles rolled off BYD’s plant in Uzbekistan; the plant started production early this year.
● Baidu launched Ernie 4.0 Turbo.
Technical observations
BYD 1211.hk confluence of overhead trendlines.
Note chart features:
1. BYD has three features that indicate it is in an uptrend. Firstly it is trading above its moving average indicators and these indicators have built a number of golden crosses this year. This setup is associated with further gains. Secondly BYD moved in a zigzag manner this year that built a series of higher swing highs and higher swing lows. This is a structure that is associated with uptrending stocks. Lastly, we can see a rising parallel channel which the stock clearly complies with.
2. Despite its gains, BYD is now nudged against a trendline drawn from major highs going back to June 2022. This trendline is very prominent and could have followers. The highs of weekly candles over the past four weeks closed at or near to this trendline. It is possible that the market is applying the overhead trendline to trading. Additionally, these four weeks are also at the top of the rising channel.
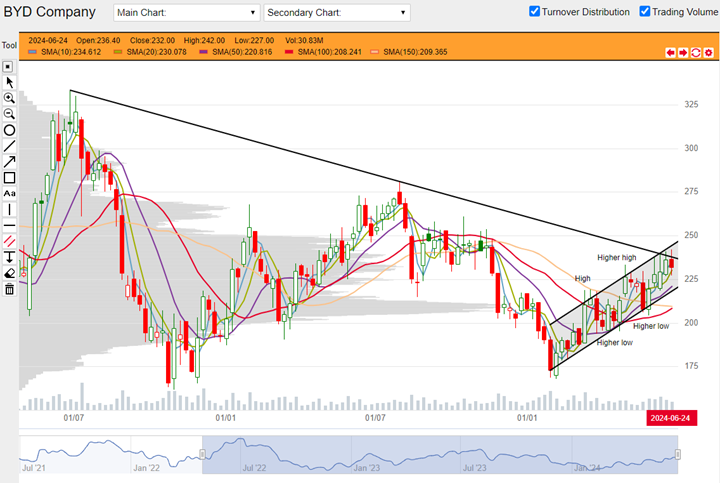
BYD 1211.hk weekly chart from 02 May 2022 to 28 June 2024. (Source: DLC.socgen.com)
Underlying Index/Stock |
Underlying Chg (%)1 |
Long DLC (Bid Change%2) |
Short DLC (Bid Change%2) |
|---|---|---|---|
| Hang Seng Index (HSI) | -1.20% | RQGW (-5.38%) | WIEW (+3.14%) |
| Hang Seng TECH Index (HSTECH) | -2.48% | ECJW (-5.73%) | 9B2W (+10.77%) |
| BYD Company (1211.HK) | -3.25% | W3QW (-11.51%) | REGW (+11.25%) |
Brought to you by SG DLC Team
This advertisement has not been reviewed by the Monetary Authority of Singapore. This advertisement is distributed by Société Générale, Singapore Branch. This advertisement does not form part of any offer or invitation to buy or sell any daily leverage certificates (the “DLCs”), and nothing herein should be considered as financial advice or recommendation. The price may rise and fall in value rapidly and holders may lose all of their investment. Any past performance is not indicative of future performance. Investments in DLCs carry significant risks, please see dlc.socgen.com for further information and relevant risks. The DLCs are for specified investment products (SIP) qualified investors only.
Full Disclaimer - here