Daily Leverage Certificates
DLC Hotline: (65) 6226 2828
Market Commentary (Hong Kong)
For the week ending 21 June 2024
The Dollar Index, WTI and Brent Crude power higher. USDCNH printed a new year-to-date high while USDJPY closed at 159.8 which is its highest end-of-week close this year.
● Malaysia will begin formal procedures to join the BRICS.
● BMW’s made-in-China electric Mini could be hit by the EU’s highest EV tariff of 38.1%.
● Norinchukin Bank of Japan will sell $63 billion of US and European government bonds during the year ending March 2025.
● The Swiss National Bank unexpectedly cut interest rates for the second this year by 25 basis points to 1.25%.
● The 2024 Central Banks Gold Reserves survey found that 29% of central banks plan to add to gold reserves. 62% think that reserves denominated in USD will become lower in the next five years.
Hang Seng Index closed this week at 18029, up 87 points or 0.48%. There is a parallel channel drawn from previous swing lows. The highs and lows of this channel could serve as reference for potential supports and resistances. HSI’s candle this week could be a nod to the presence of the higher bound of this channel. However its long tail overhead is also a nod to the presence of the 10 and 20-Day SMAs. The higher swing high printed in May this year compared to the one in March makes up a setup that is associated with further gains. A number of golden crosses printed by its basket of moving averages are also associated with further gains.
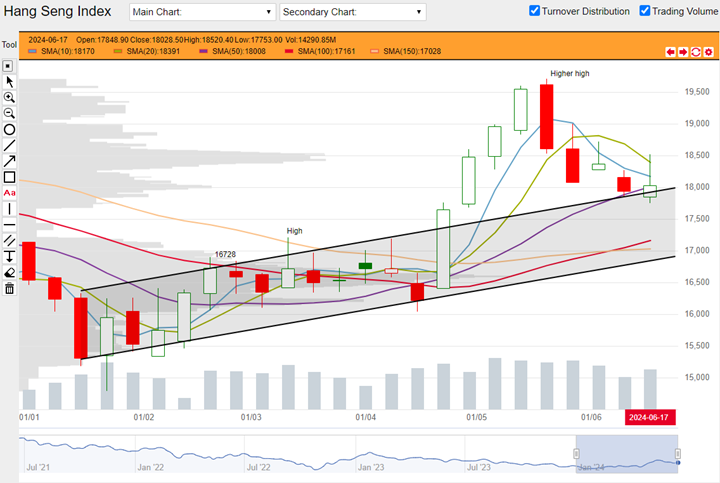
HSI weekly chart from 01 January 2024 to 21 June 2024 (Source: DLC.socgen.com)
Hang Seng Tech closed the week at 3701, down 6 points or 0.17%. The index closed below its 10, 20 and 50-Day SMAs. These indicators could become potential resistance. The long upper tail in this week’s candle could be a nod to the presence of these indicators. The higher swing high printed in May this year compared to the one in March is associated with further gains. A number of golden crosses printed by its moving averages are also associated with further gains.
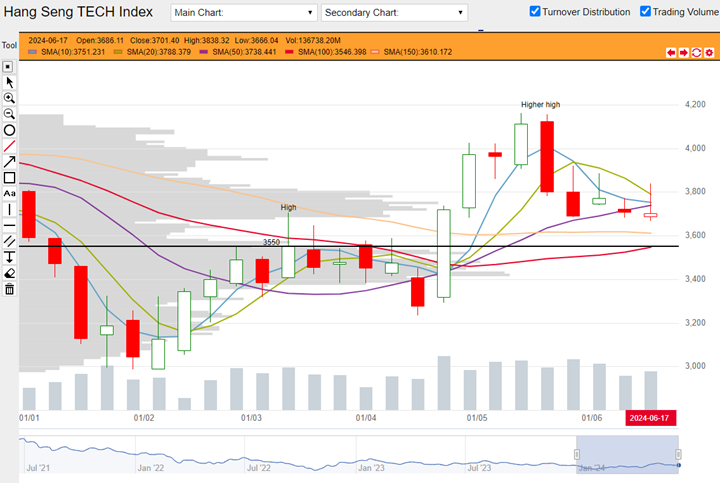
HSTech weekly chart from 01 January 2024 to 21 June 2024 (Source: DLC.socgen.com)
The Dow closed its best performance in the last five weeks. Nasdaq 100 printed another new all-time-high but closed as a shooting star candlestick. NVDA, which is a major investment theme, made another new all-time-high but closed the week as a long bearish candle. This was its worst performance in nine weeks.
The next FOMC meeting is scheduled on 31 July 2024.
Fed funds futures on rate hike probability by next Fed meeting as at this week’s close:
● 10.3% probability of 25 basis points cut |89.7% probability of no change
Fed funds futures on rate hike probability by next Fed meeting at last week’s close:
● 10.3% probability of 25 basis points cut |89.7% probability of no change
Probabilities on the CME Fedwatch Tool indicate a 25-basis points cut could start as early as the coming FOMC meeting in July. There is also a possibility for a cumulative 100 basis points cut between now to December this year.
Shanghai and Shenzhen continued to fall this week. It is now five weeks since Shanghai’s highest performance year-to-date and seven weeks for Shenzhen. Both indices closed below their array of moving average indicators. This setup is associated with further losses. However both indices closed near to their swing low printed in mid-April this year. This mid-April swing low could be a reference for potential support.
Other news:
● AIA, Kuaishou, Meituan, Tencent and Xiaomi bought back shares.
● CNOOC printed a new 52-week high. Baidu, Ganfeng Lithium and Sands China printed new 52-week lows.
● Bloomberg News reported that Hong Kong Exchange will no longer suspend operations during severe weather starting from 23 September this year.
Technical observations
Xiaomi 1810.hk bullish expansion candle sitting on former 52-week high.
Note chart features:
1. $16.98 was 2023’s highest transacted price printed in mid-November. In its place, there is a swing high. This kind of high, also known as a 52-week high, is formed by major turning points and therefore associated with significant support and resistance levels. Fast forward to early-April this year, it is evident that the presence of that 52-week was acknowledged by the market (see down arrow). Fast forward again to this week and last, price action suggests that Xiaomi could be reacting to this level.
2. In addition to the previous 52-week high, this week’s candle is a bullish expansion compared to the past two weeks. Together the trio could make up a bullish candlestick combination. Note also that this week’s candle closed above its 10, 20 and 50-Day SMAs at one go.
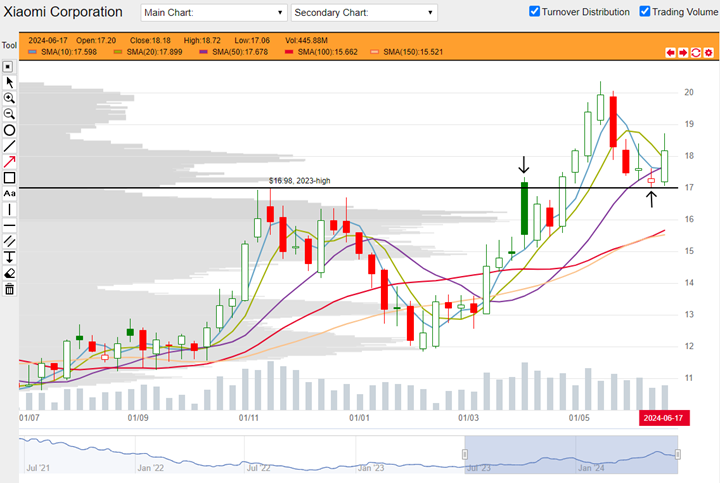
Xiaomi 1810.hk weekly chart from 03 July 2023 to 21 June 2024. (Source: DLC.socgen.com)
Underlying Index/Stock |
Underlying Chg (%)1 |
Long DLC (Bid Change%2) |
Short DLC (Bid Change%2) |
|---|---|---|---|
| Hang Seng Index (HSI) | -1.34% | CVMW (-6.45%) | WIEW (+5.48%) |
| Hang Seng TECH Index (HSTECH) | -2.48% | WYHW (-15.89%) | 9B2W (+16.36%) |
| Xiaomi Corporation (1810.HK) | -2.61% | XPKW (-9.69%) | YW5W (+17.65%) |
Brought to you by SG DLC Team
This advertisement has not been reviewed by the Monetary Authority of Singapore. This advertisement is distributed by Société Générale, Singapore Branch. This advertisement does not form part of any offer or invitation to buy or sell any daily leverage certificates (the “DLCs”), and nothing herein should be considered as financial advice or recommendation. The price may rise and fall in value rapidly and holders may lose all of their investment. Any past performance is not indicative of future performance. Investments in DLCs carry significant risks, please see dlc.socgen.com for further information and relevant risks. The DLCs are for specified investment products (SIP) qualified investors only.
Full Disclaimer - here